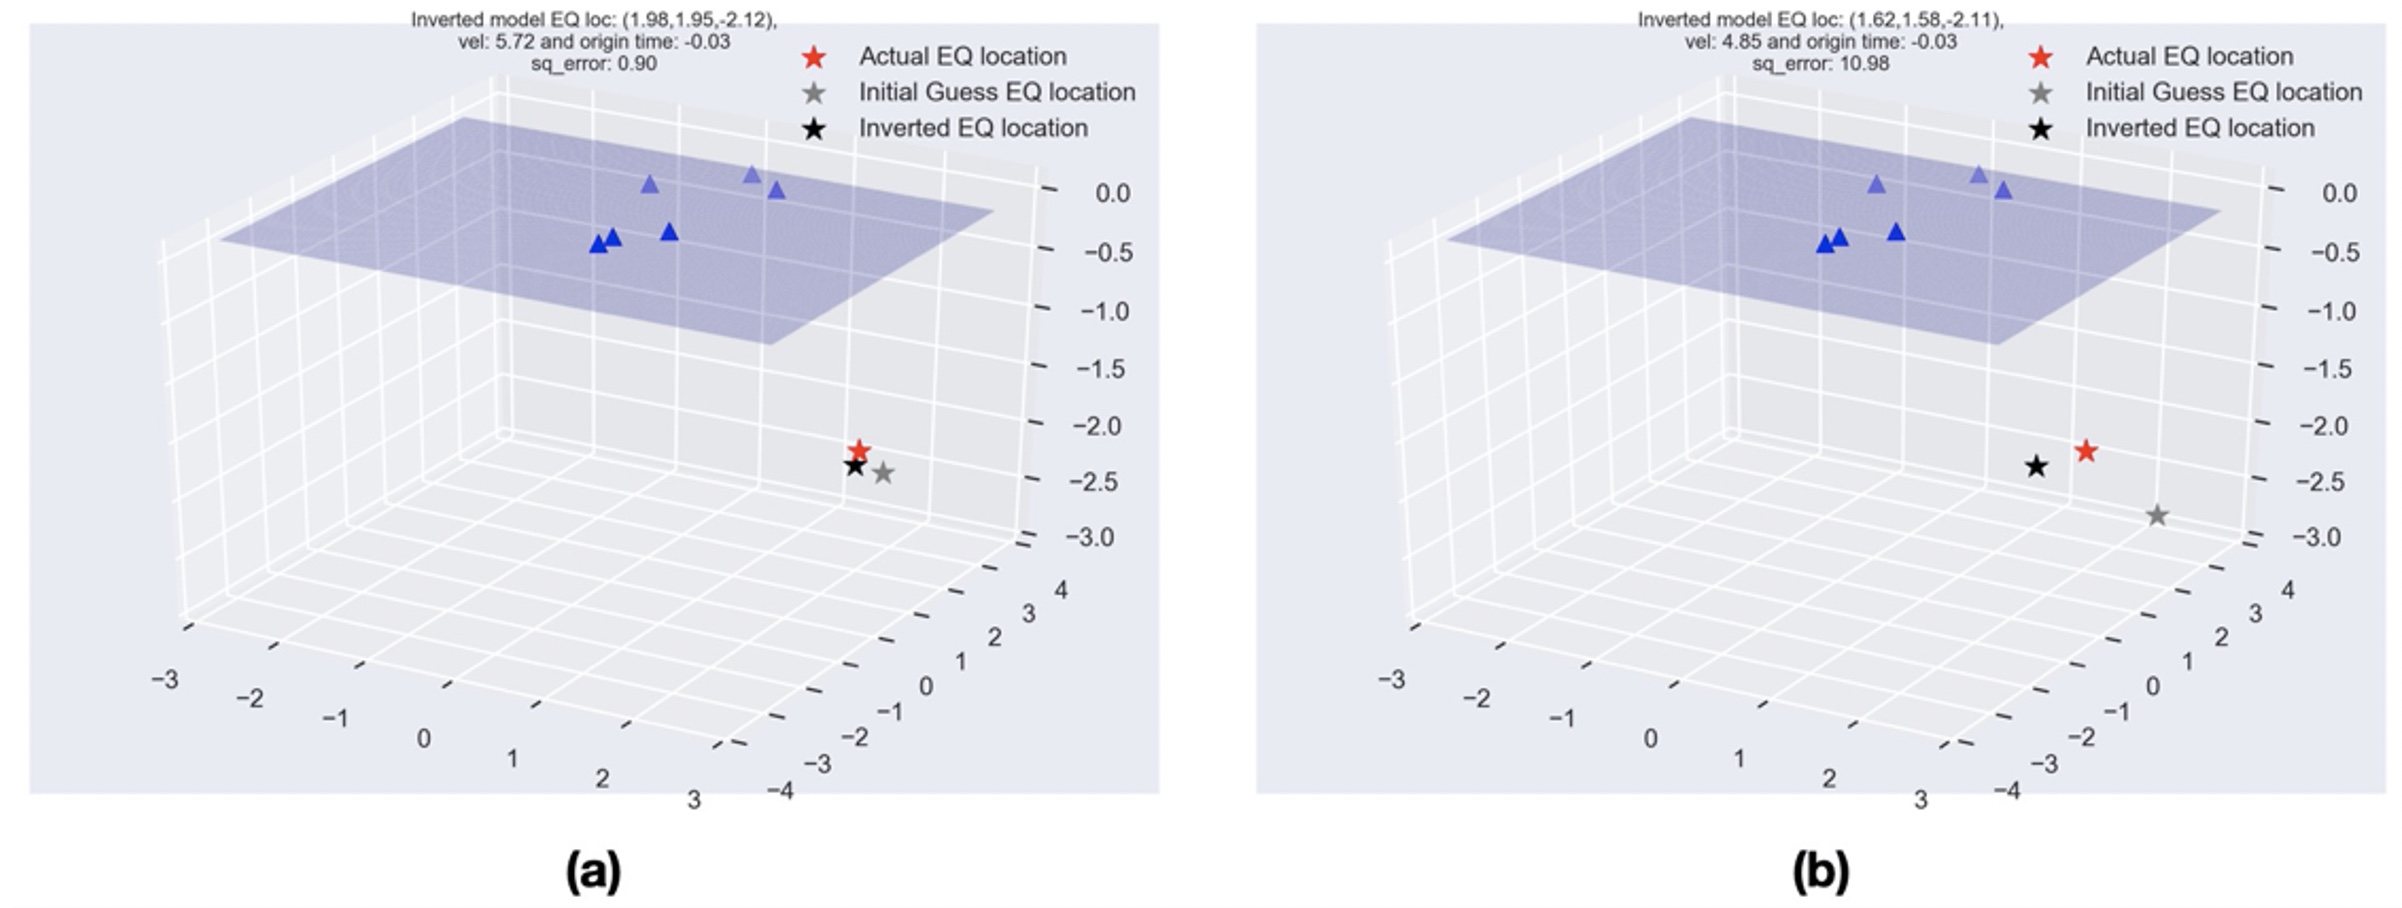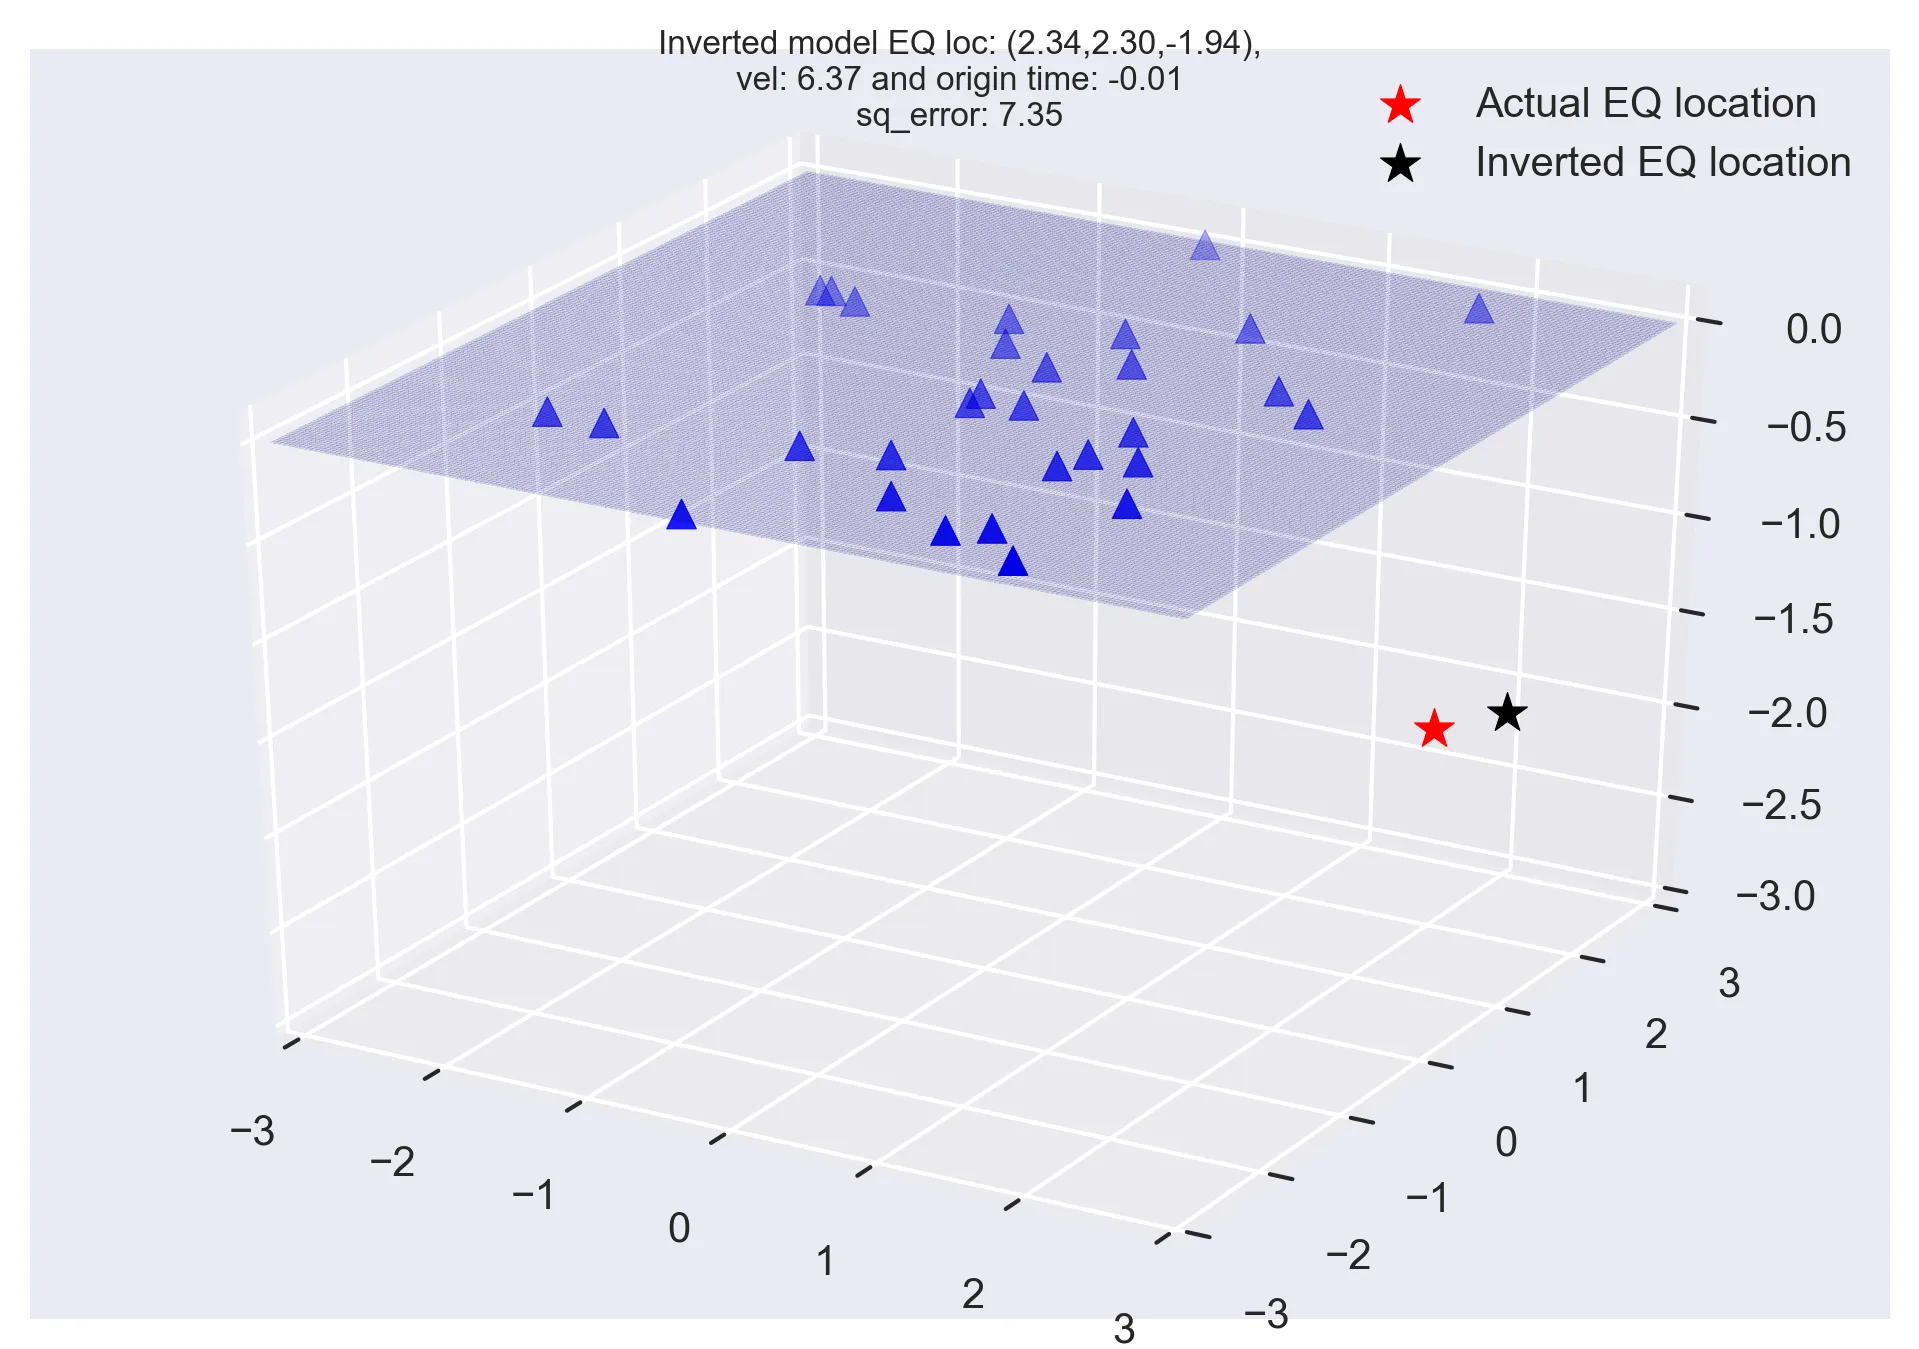
Monte Carlo methods and earthquake location problem (codes included)
The common geophysical problems most often have multimodal objective function with many possible minima. In...

Earth Inversion
Technical writing on geophysical pipelines, scalable data analysis, and reproducible research engineering.
Peer-reviewed work in seismology, structural health monitoring, and large-scale inversion.
End-to-end workflows for high-volume scientific data: ingestion, QC, feature extraction, and modeling.
Cloud and web platforms for real-time sensing, visualization, and operational analytics.
The common geophysical problems most often have multimodal objective function with many possible minima. In...
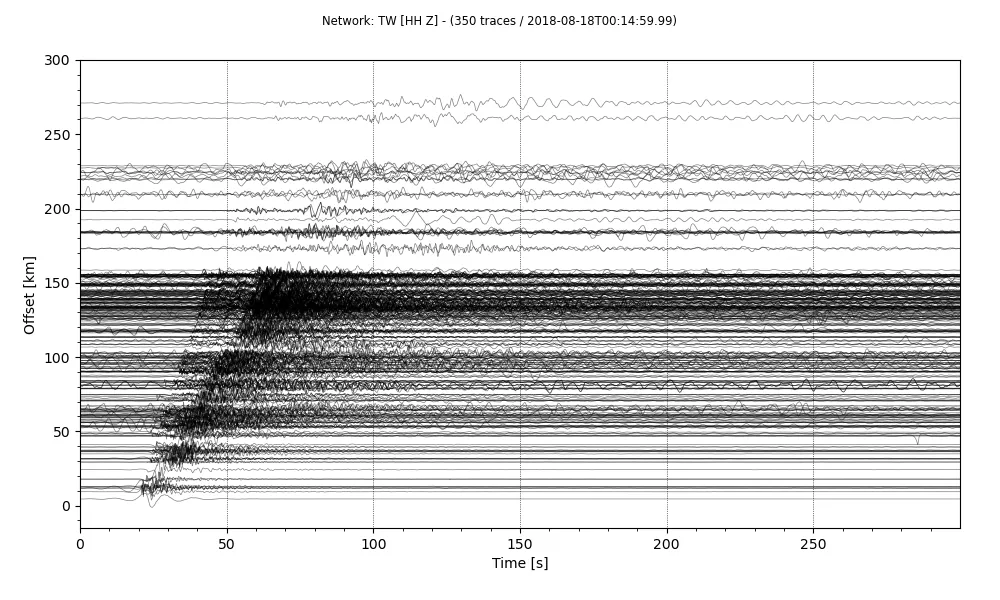
Quickly plot record section of a stream using Obspy. I will introduce you how to make a stream from a set o...
Recent technical articles on seismic analytics, scientific computing, numerical modeling, and production data workflows.
If you are ready to use the Microsoft Word as your favourite tool for writing your awesome scientific thoughts and ideas into a manuscript, then I would like...
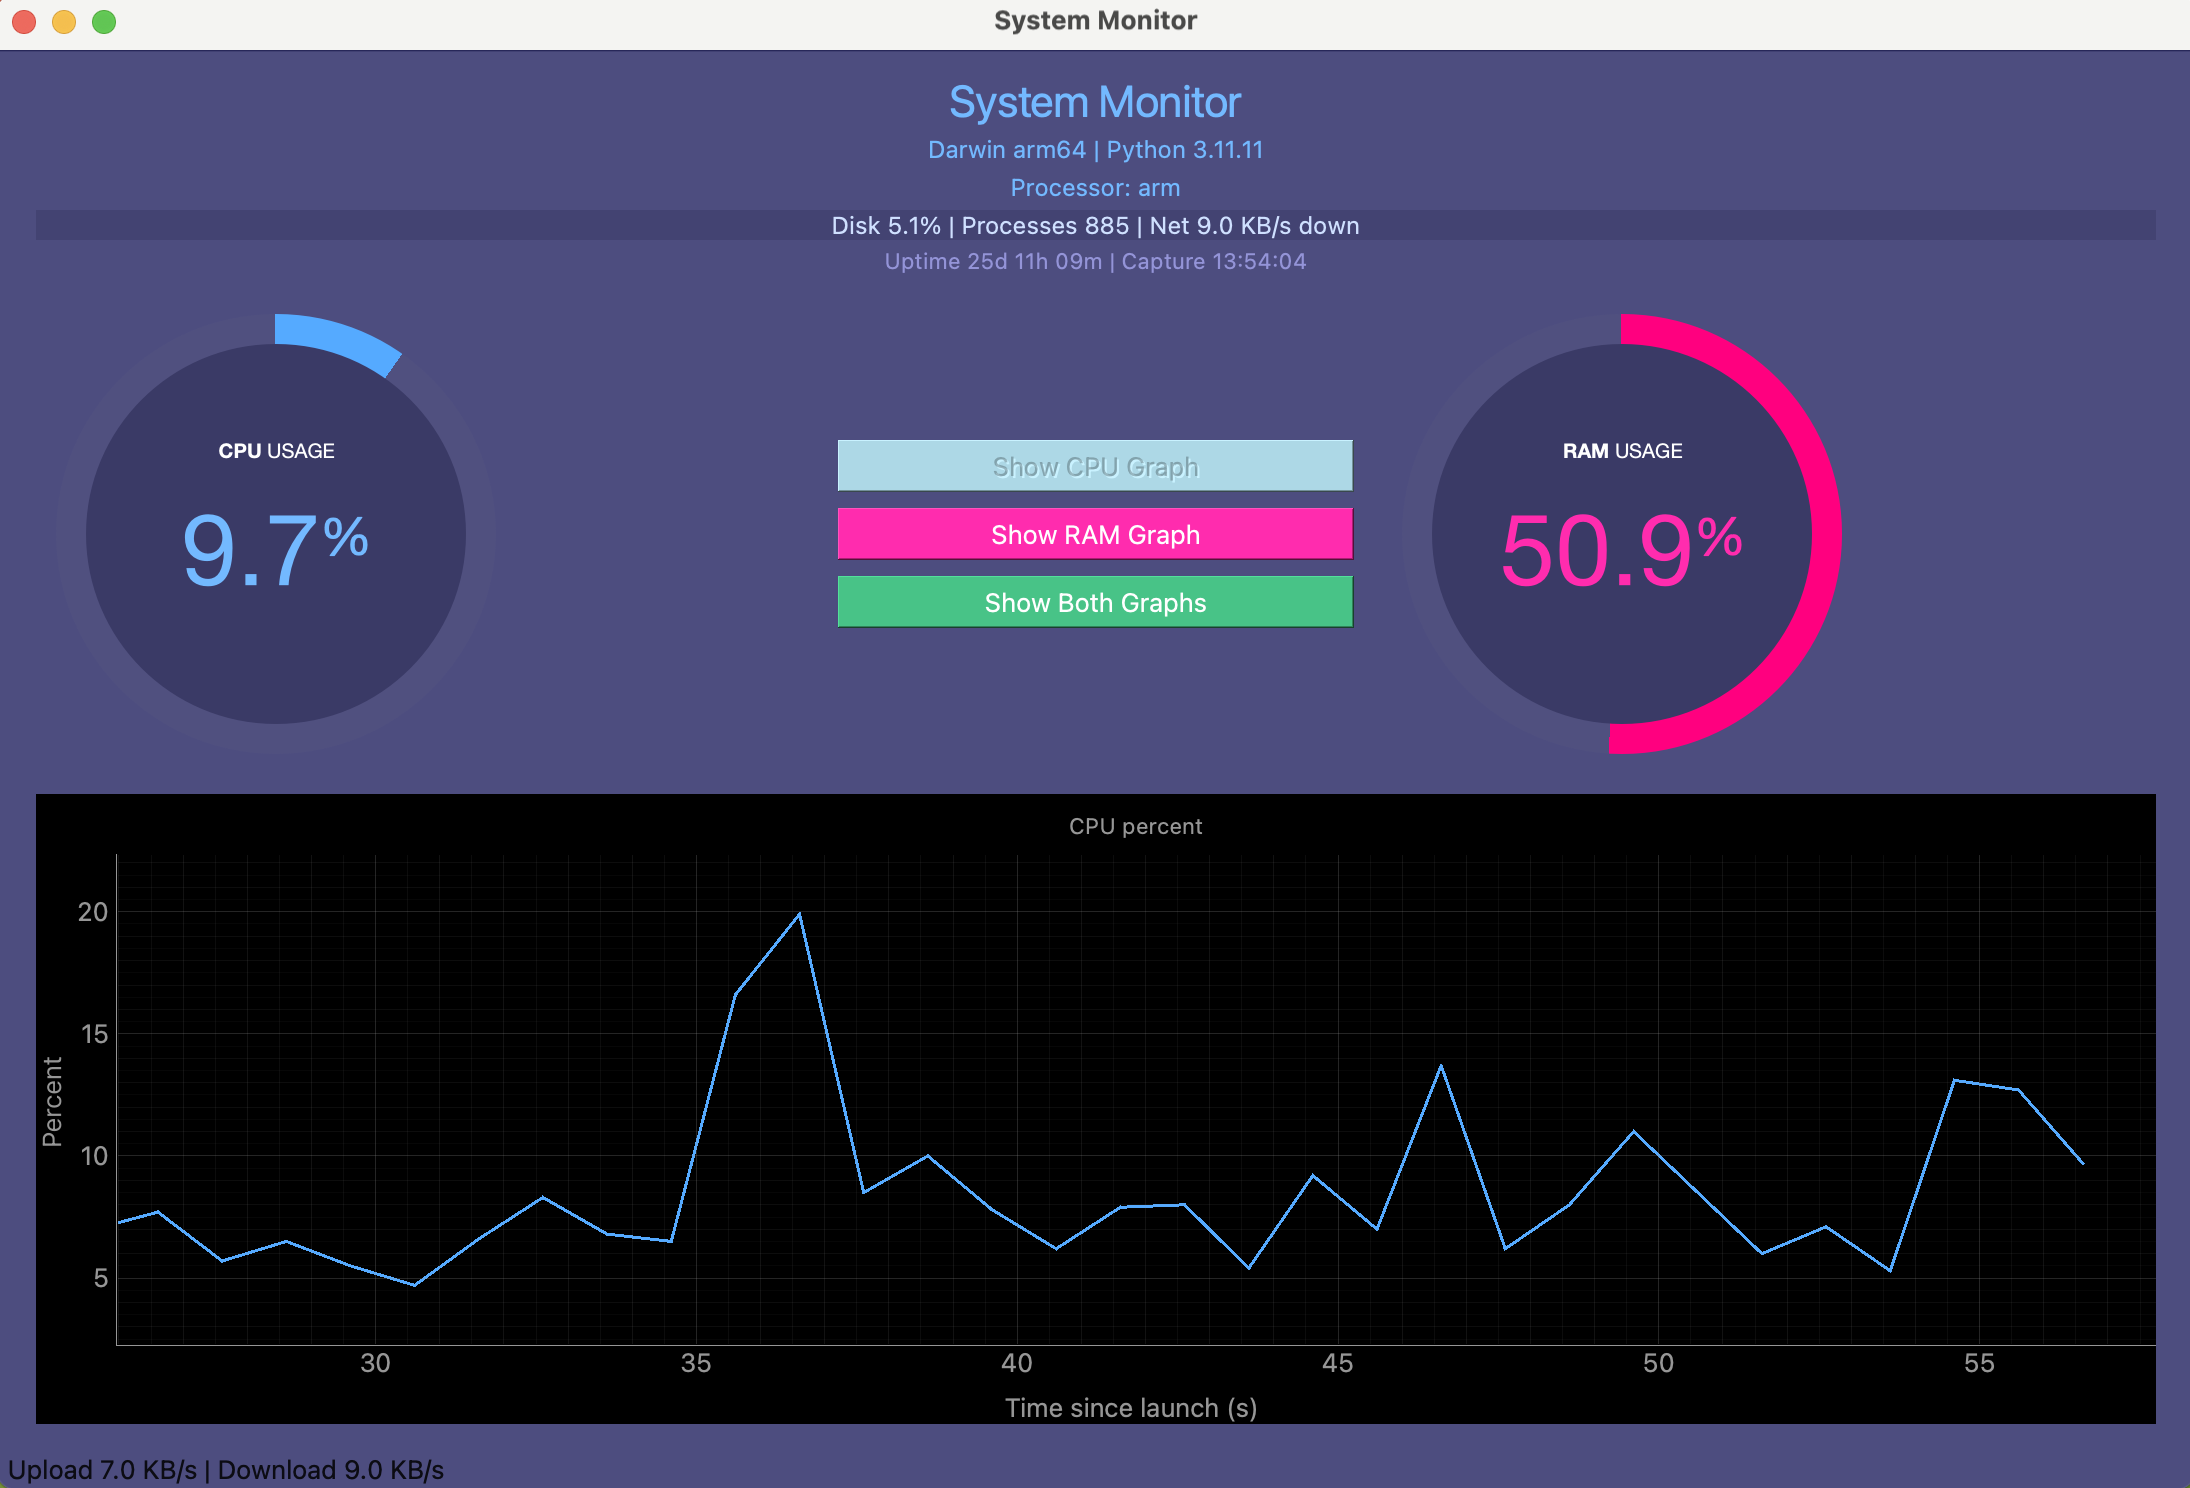
I built a cross-platform Python desktop app to monitor CPU, RAM, disk, processes, and network usage in real time.
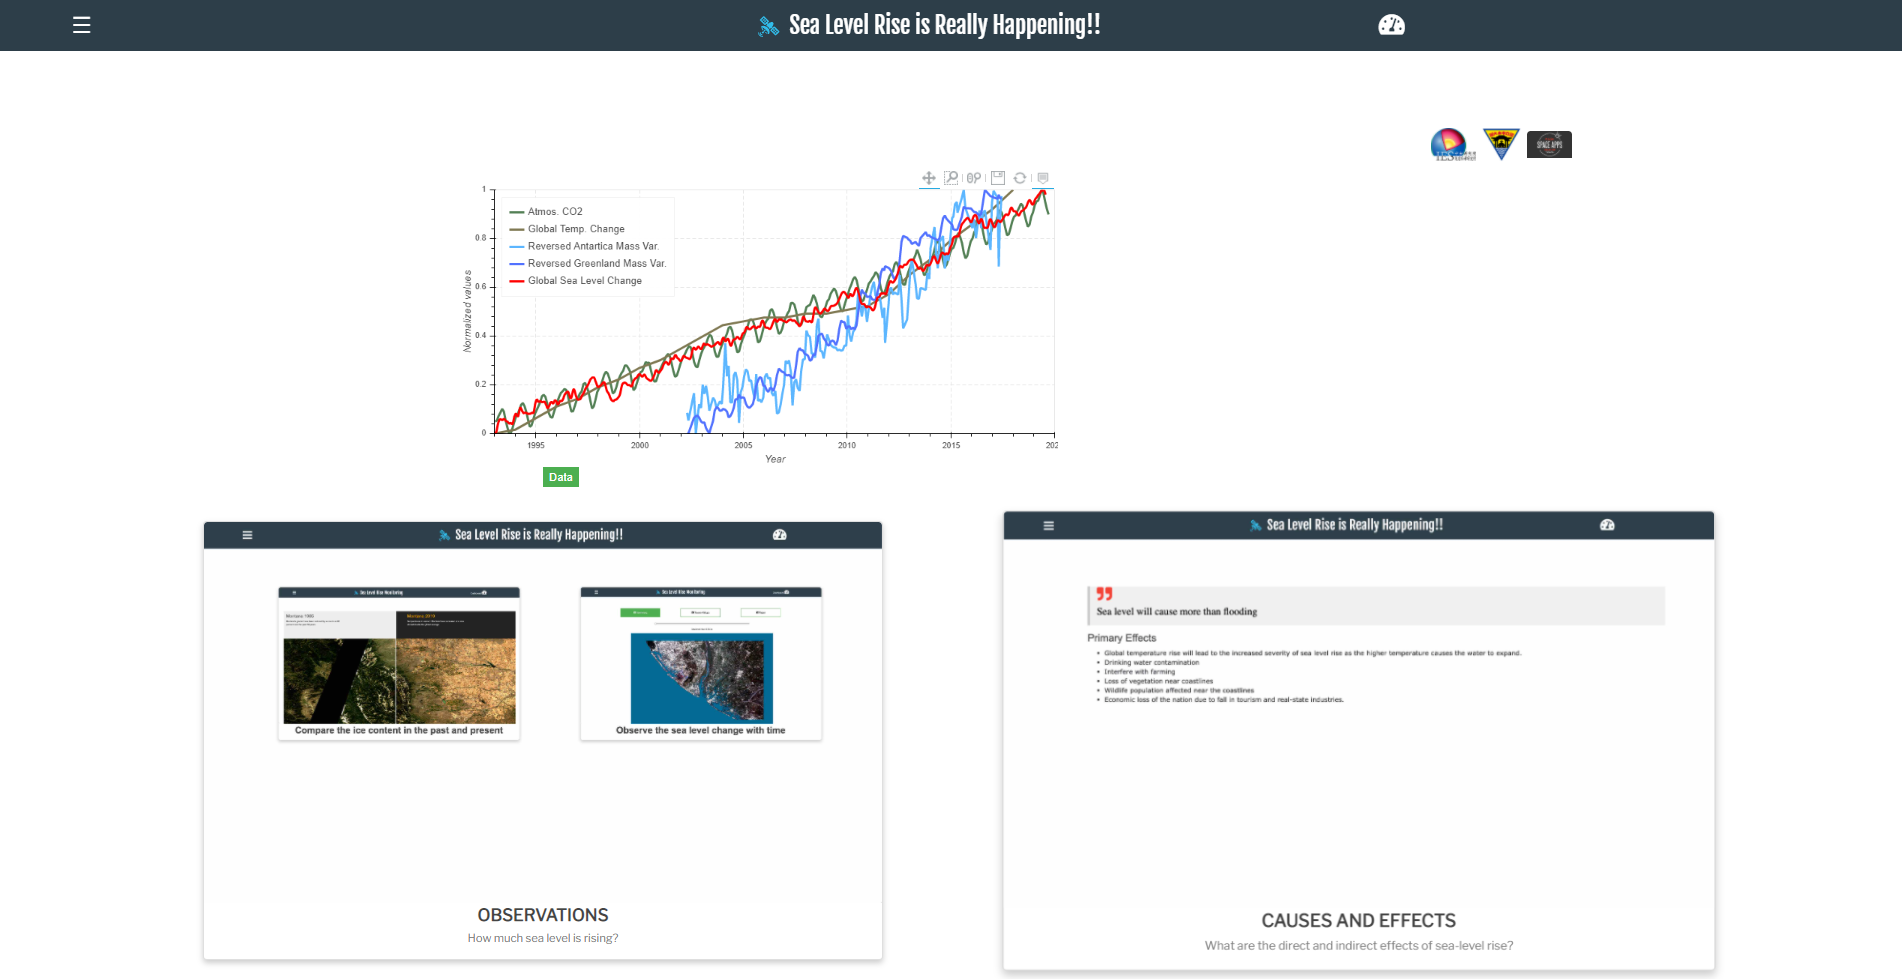
This post gives a quick introduction on how to build a web application using Flask and deploy on Heroku server. Then, I share my codes for building advanced ...
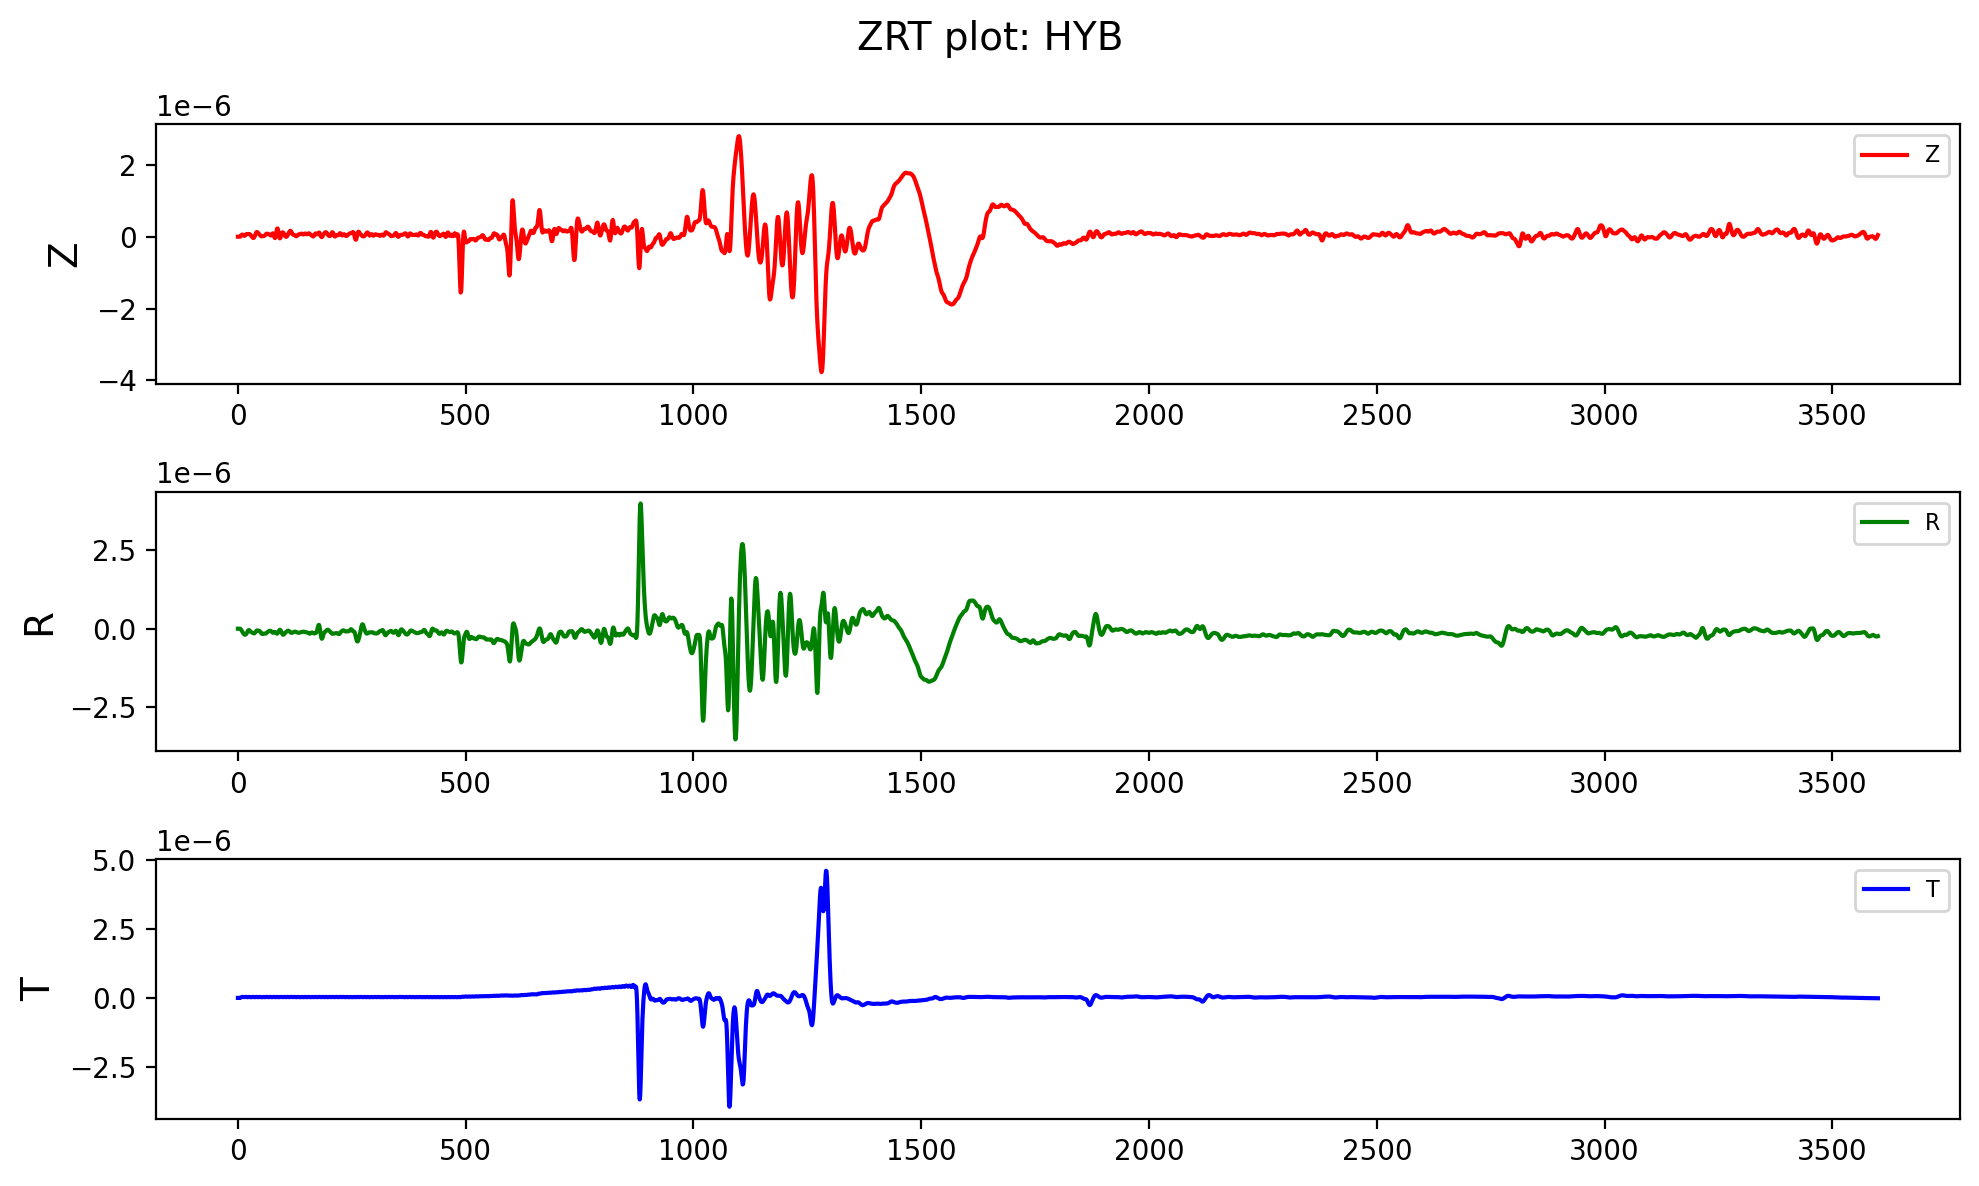
In this post, I will read a ASCII file whose first few lines contains the header information and then the three-component data. I will read using the pandas ...
Least-squares method is a popular approach in geophysical inversion to estimate the parameters of a postulated Earth model from given observations. This meth...
Parallel computing is quickly becoming a necessity. Modern computers comes with more than one process and we most often only use single process to do most of...
Codes for plotting advanced 2D plots using matplotlib library in Python. Includes simple 2D plot, error bars, bar graphs, histograms, multiple plots, etc
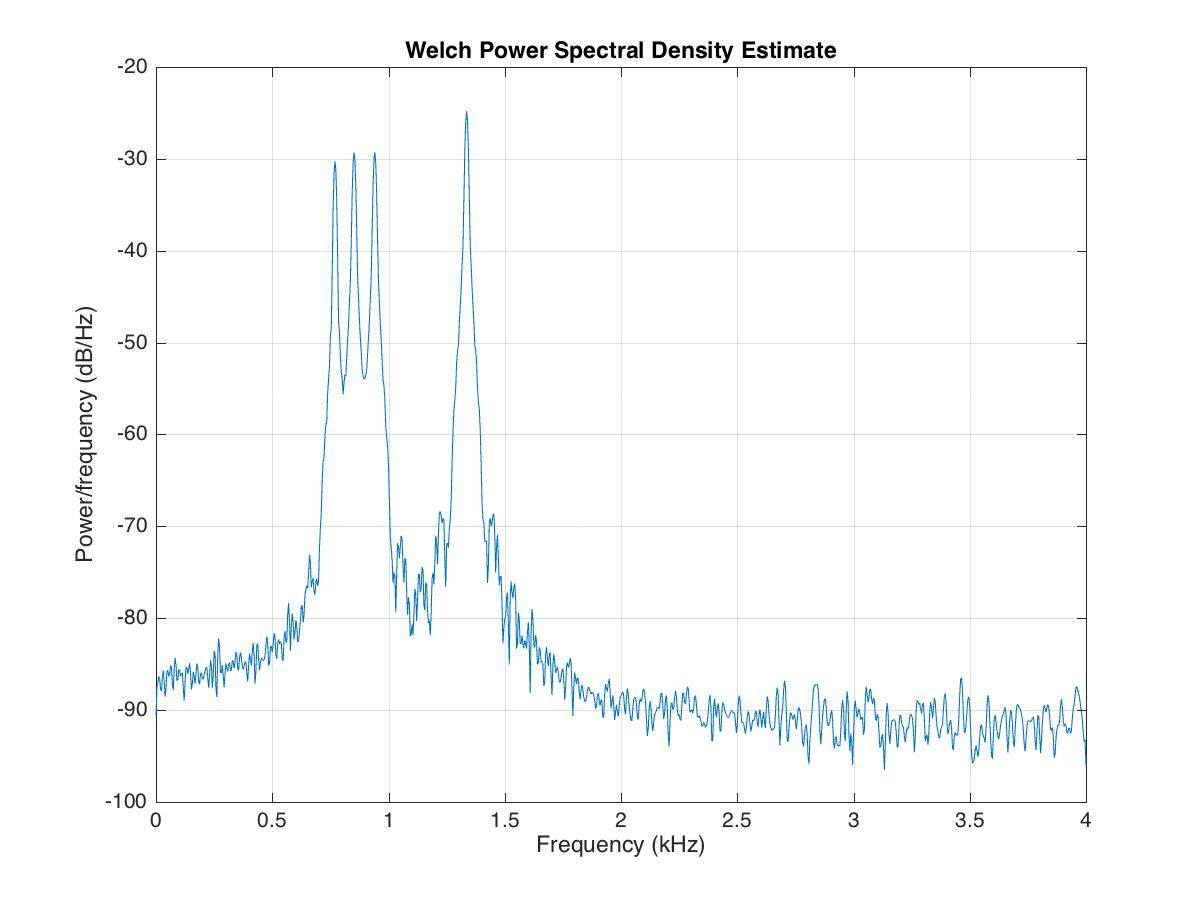
A signal has one or more frequency components in it and can be viewed from two different standpoints: time-domain and frequency domain. In general, signals a...
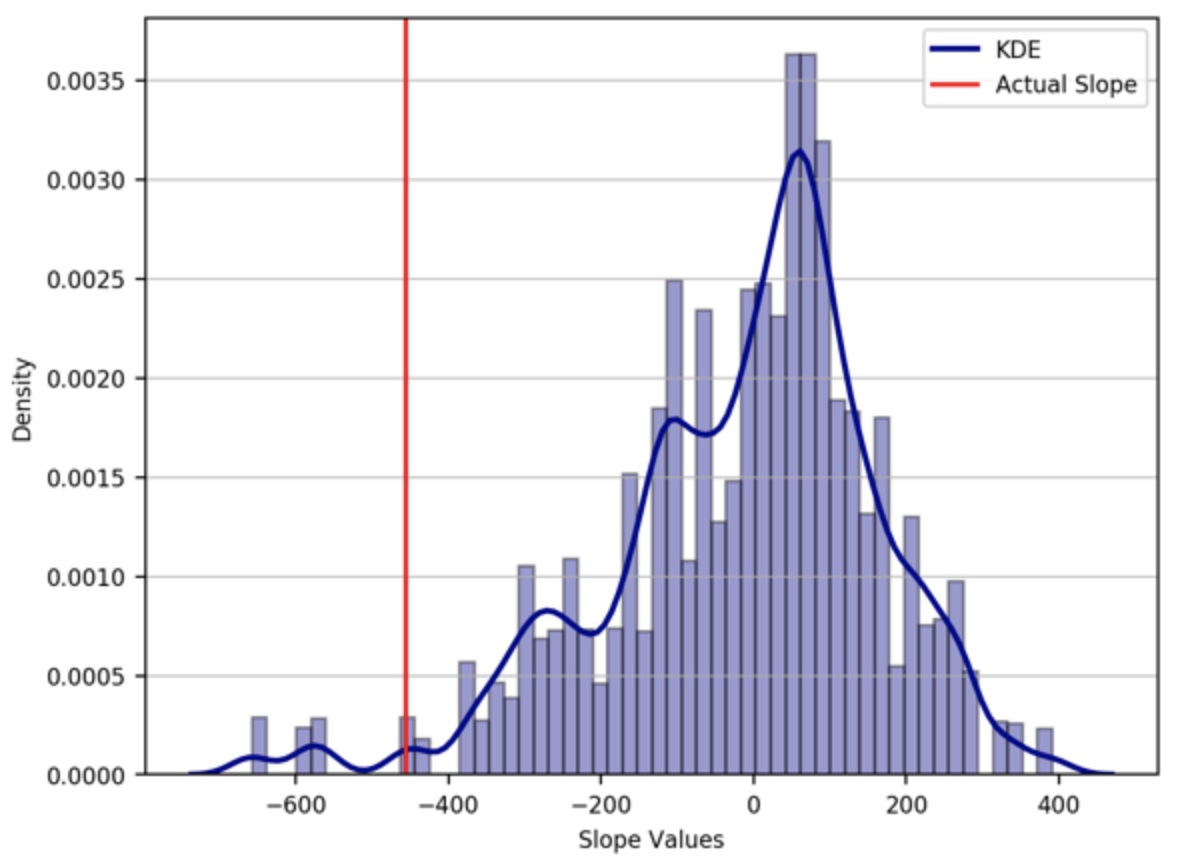
We pose a null hypothesis and enquire that given that the null hypothesis is true, how likely is the observed pattern of results? This likelihood is known as...
Most often data analyst consider correlation between two time-series as a causation effect. Two time-series are correlated that does not imply that one cause...
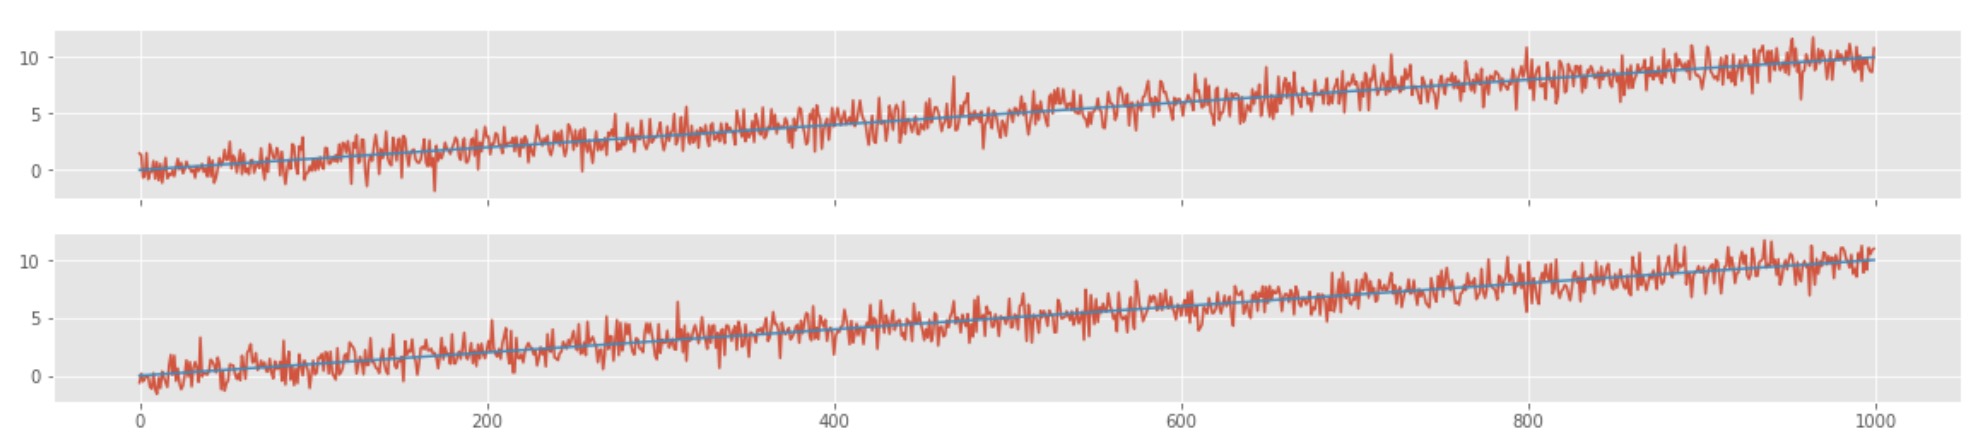
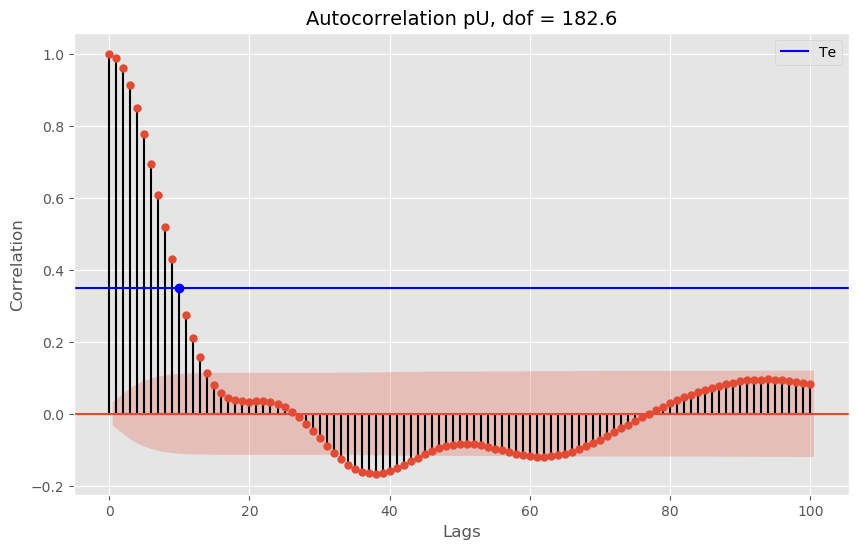
Numerical tests to understand the degrees of freedom in time series
Seismic resolution and fidelity are the two important measures of the quality of the seismic record and the seismic images. Seismic resolution quantifies the...
If you are ready to use the Microsoft Word as your favourite tool for writing your awesome scientific thoughts and ideas into a manuscript, then I would like...
I built a cross-platform Python desktop app to monitor CPU, RAM, disk, processes, and network usage in real time.
This post gives a quick introduction on how to build a web application using Flask and deploy on Heroku server. Then, I share my codes for building advanced ...
In this post, I will read a ASCII file whose first few lines contains the header information and then the three-component data. I will read using the pandas ...
Least-squares method is a popular approach in geophysical inversion to estimate the parameters of a postulated Earth model from given observations. This meth...
Parallel computing is quickly becoming a necessity. Modern computers comes with more than one process and we most often only use single process to do most of...
Codes for plotting advanced 2D plots using matplotlib library in Python. Includes simple 2D plot, error bars, bar graphs, histograms, multiple plots, etc
A signal has one or more frequency components in it and can be viewed from two different standpoints: time-domain and frequency domain. In general, signals a...
We pose a null hypothesis and enquire that given that the null hypothesis is true, how likely is the observed pattern of results? This likelihood is known as...
Most often data analyst consider correlation between two time-series as a causation effect. Two time-series are correlated that does not imply that one cause...
Numerical tests to understand the degrees of freedom in time series
Seismic resolution and fidelity are the two important measures of the quality of the seismic record and the seismic images. Seismic resolution quantifies the...