Finding Tiny Earthquakes by Their Fingerprints
A three-station seismic matched-filter experiment shows how repeating waveform shapes reveal small earthqua...

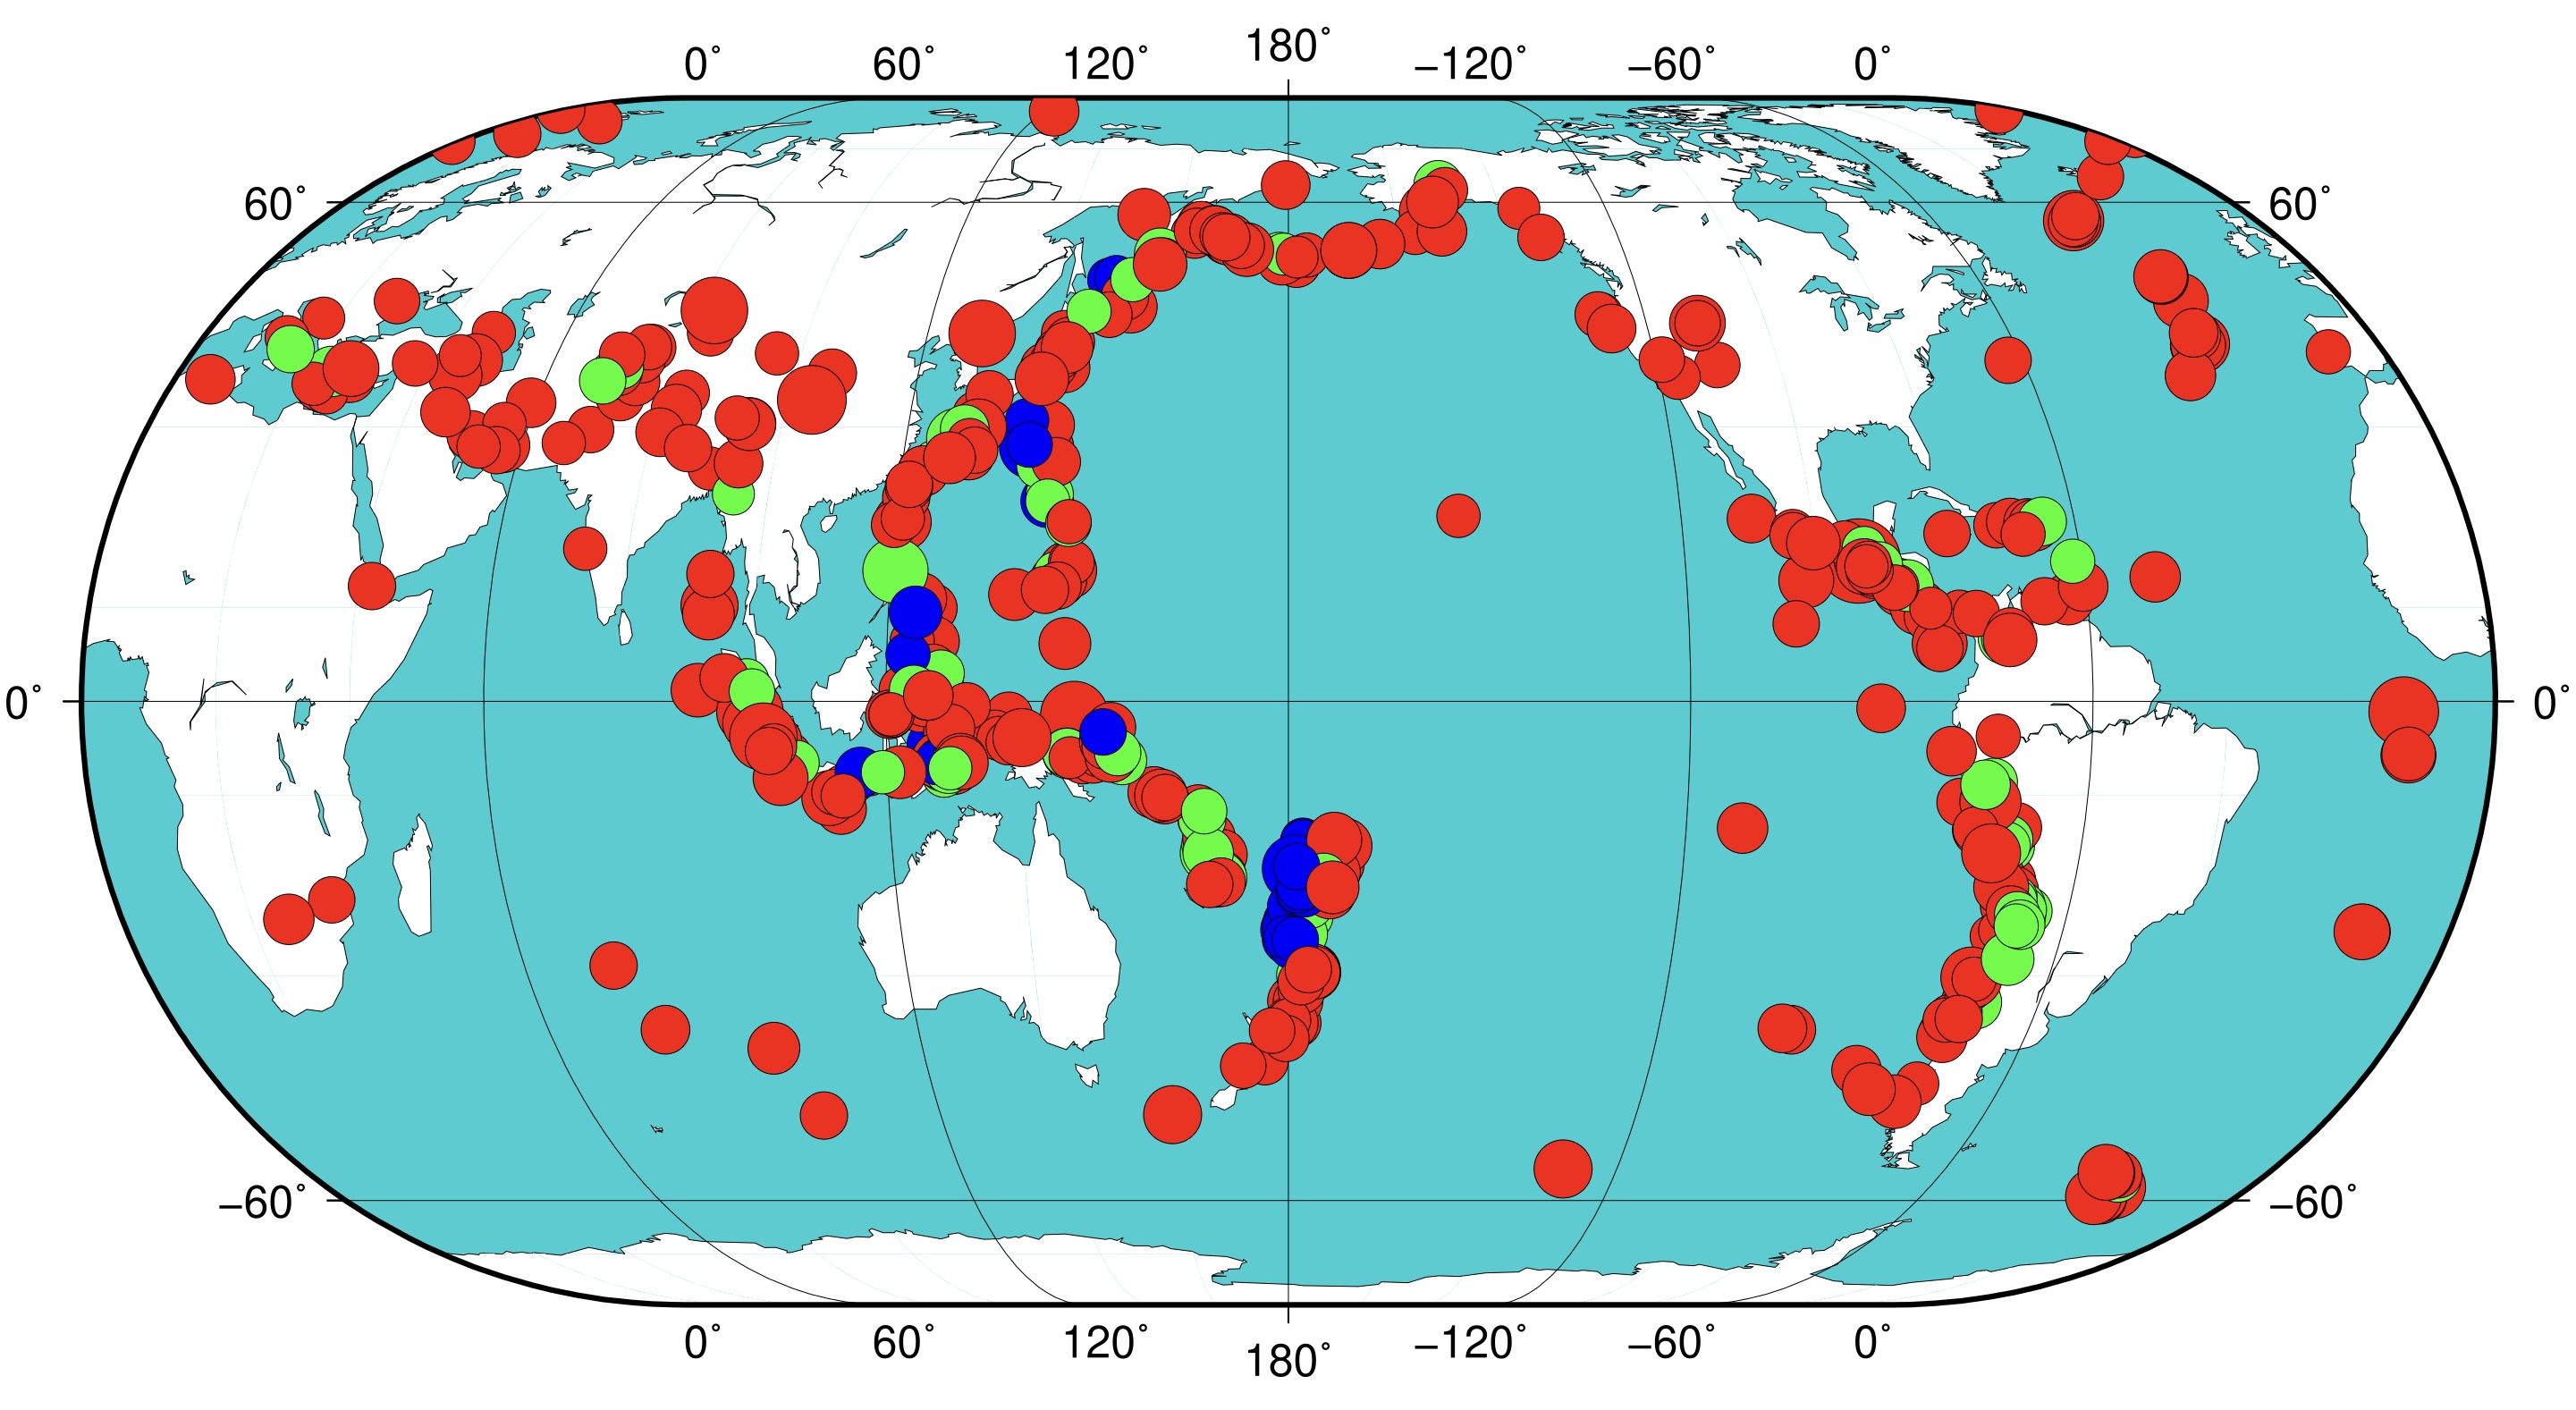
Magnitude 2.5+ over the past 24 hours.
Loading recent earthquakes…
A three-station seismic matched-filter experiment shows how repeating waveform shapes reveal small earthqua...

A simple shop-and-courier analogy explains how TCP delivers data, TLS protects it, and HTTP gives a website...
Recent technical articles on seismic analytics, scientific computing, numerical modeling, and production data workflows.
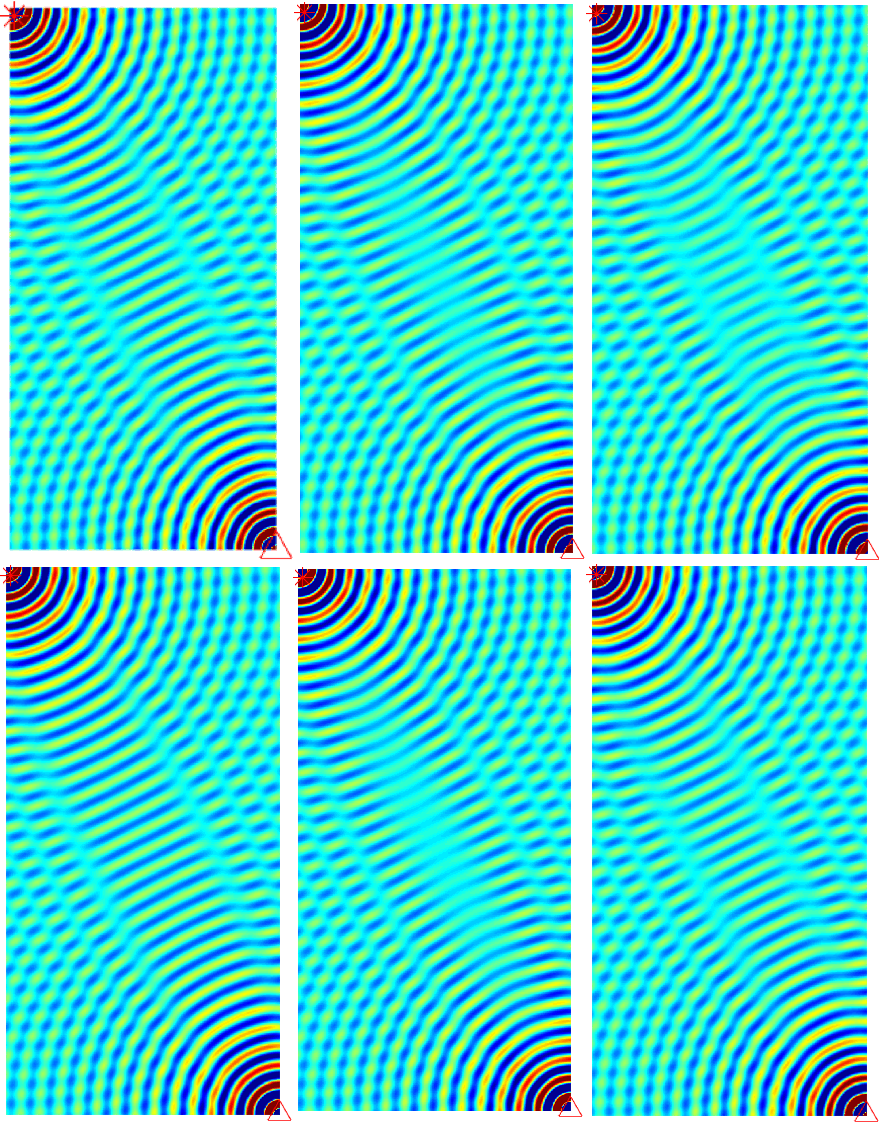
Seismic resolution and fidelity are the two important measures of the quality of the seismic record and the seismic images. Seismic resolution quantifies the...
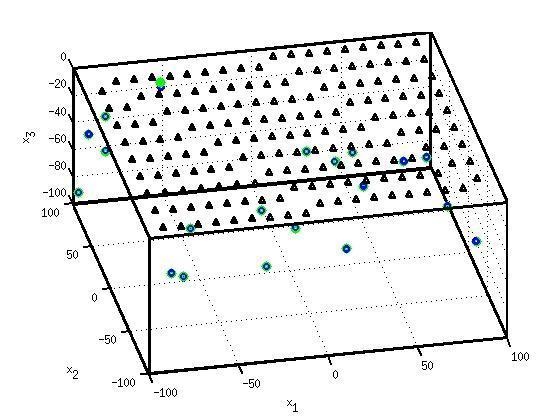
Simple earthquake location problem and its solution using Geiger’s method
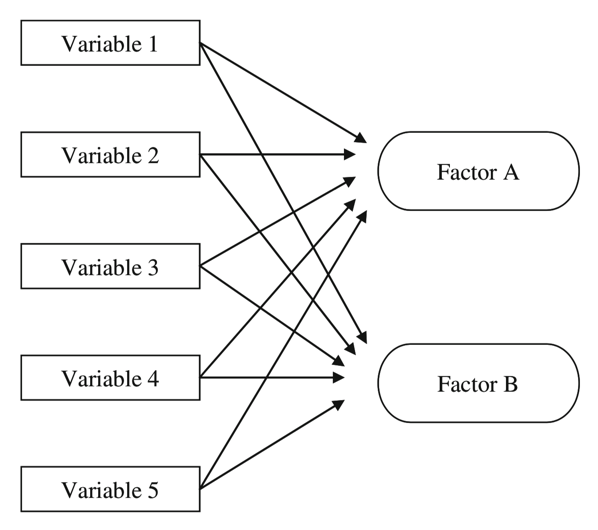
Factor Analysis is an exploratory data analysis method used to search influential underlying factors or latent variables from a set of observed variables
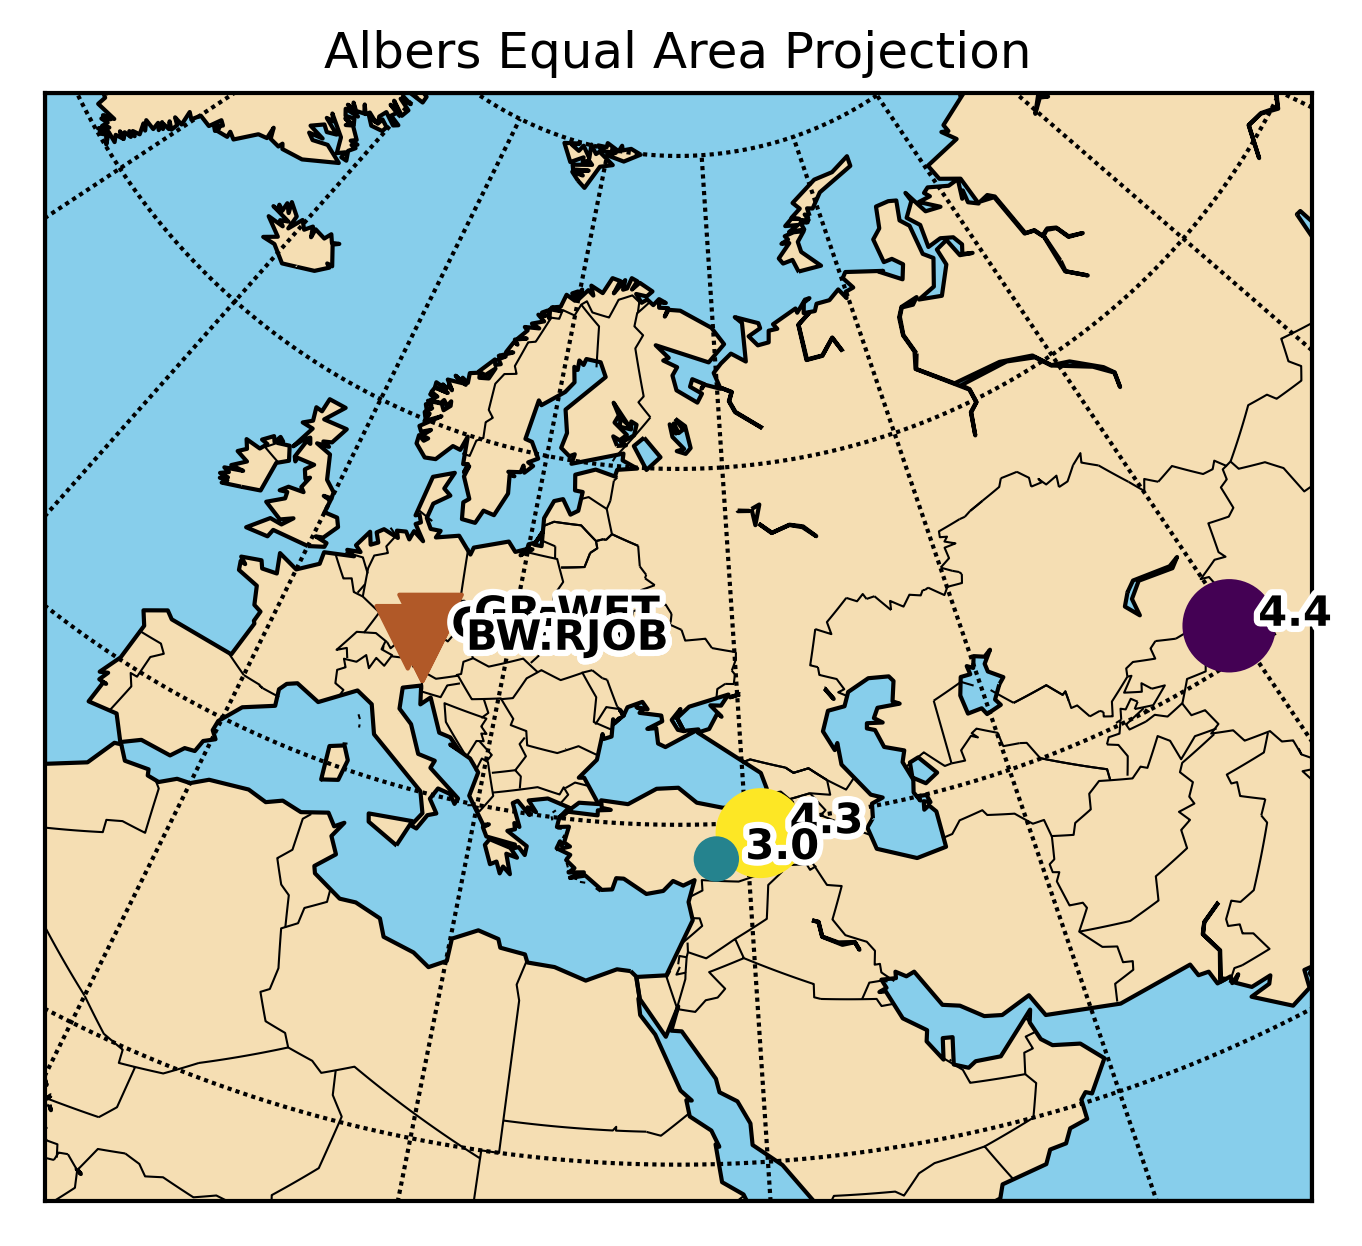
This post is aimed to resolve the issues regarding the conflicts of using obspy and basemap libraries together.
Time-series analysis is essential in most fields of science, including geophysics, economics, etc. Most of the geophysical data comes in a time-series format...
The Generic Mapping Tools is widely used across Earth and Planetary and other fields of studies to process data and generate high-quality illustrations. This...
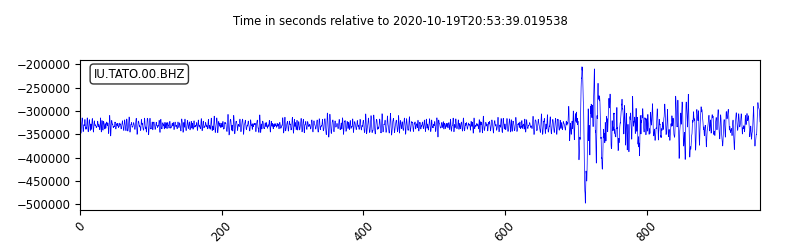
Obspy is an open-source Python framework developed for the processing of seismological data. In this post, I will introduce how to use Obspy along with some ...
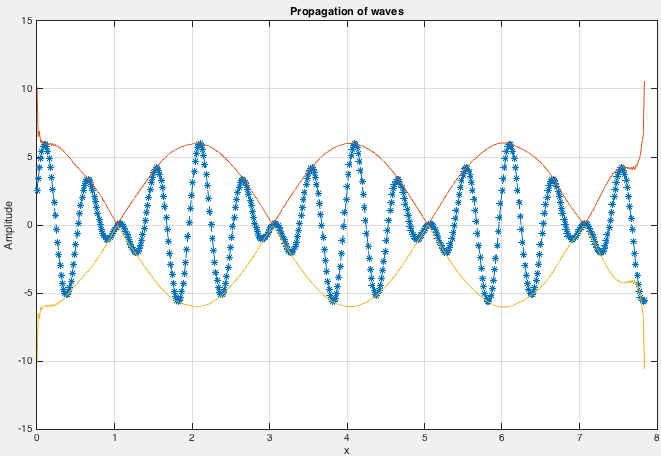
We demonstrate how to model a simple wave, obtain its frequencies, apply Hilbert transform, and perform edge detection
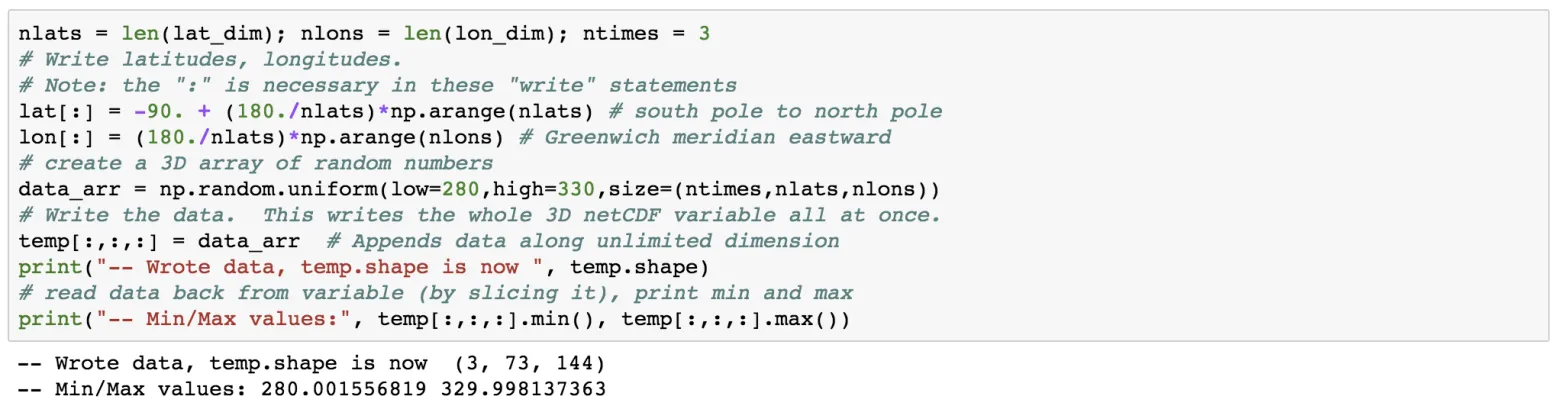
Create a reproducible NetCDF file in Python with dimensions, coordinate variables, units, missing values, compression, and correctly stored times. Includes c...
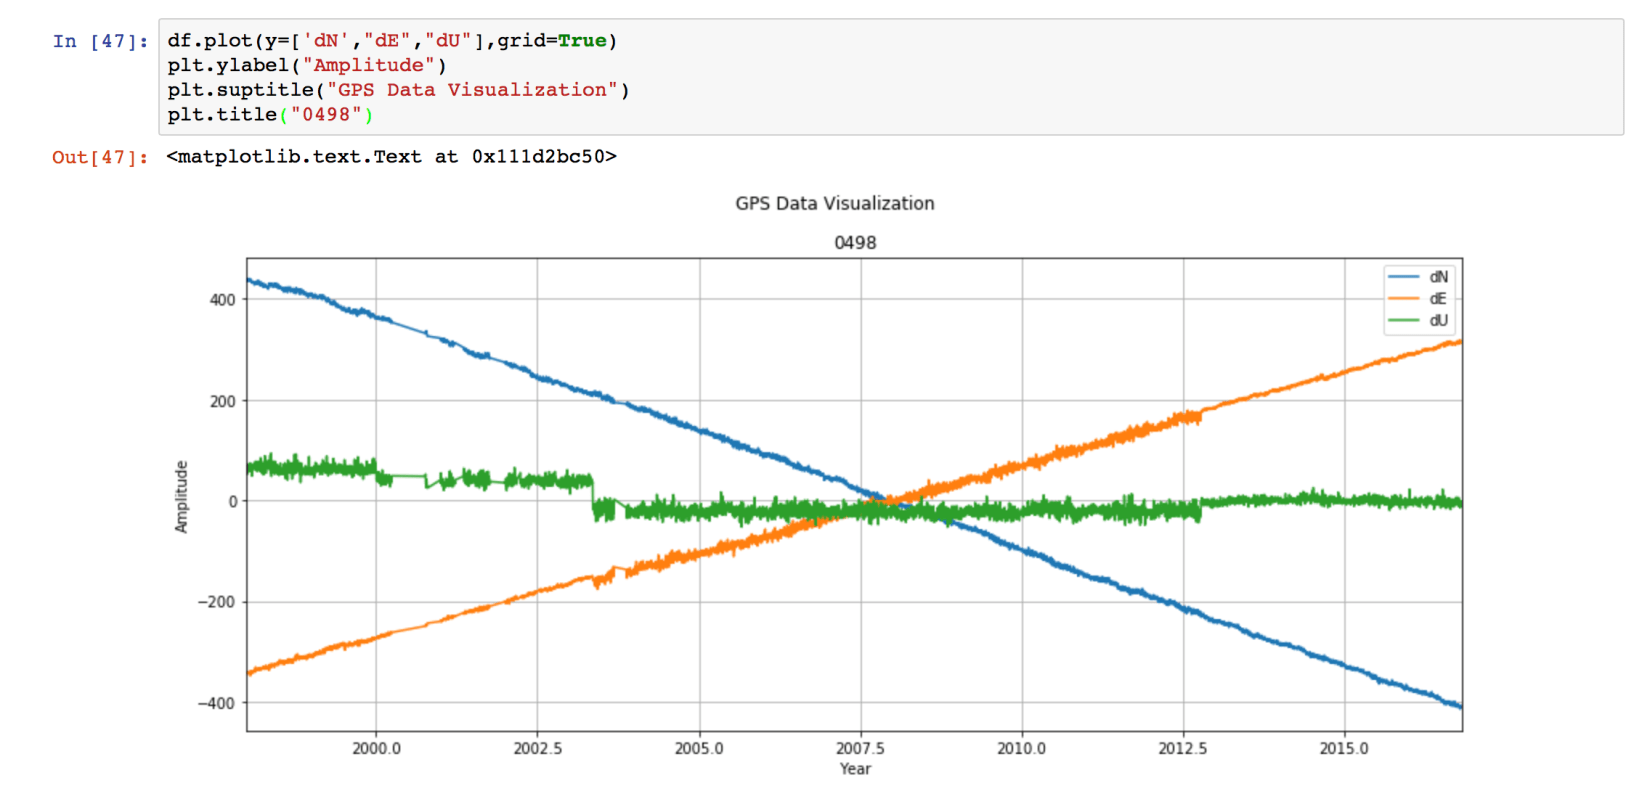
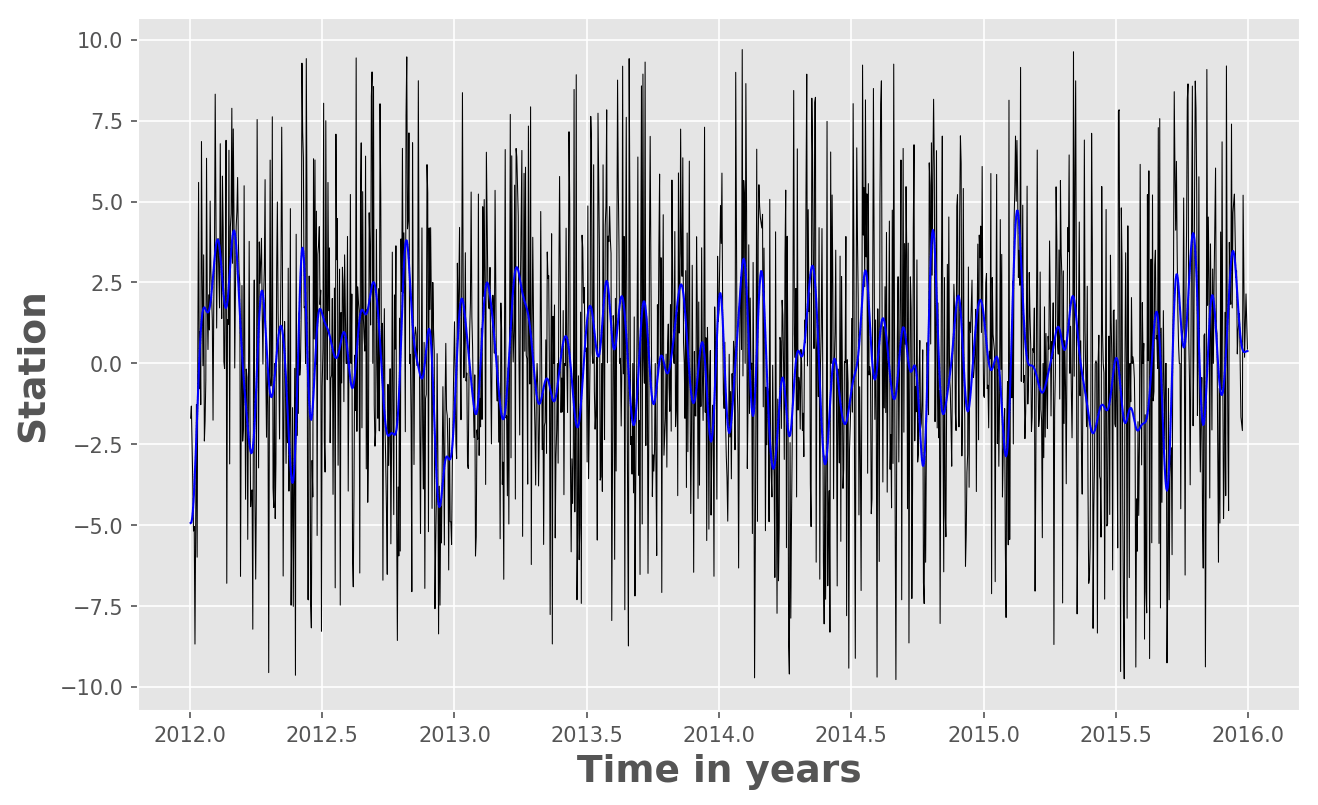
In this post, we will see how we can use Python to low-pass filter the 10 year long daily fluctuations of GPS time series. We need to use the “Scipy” package...
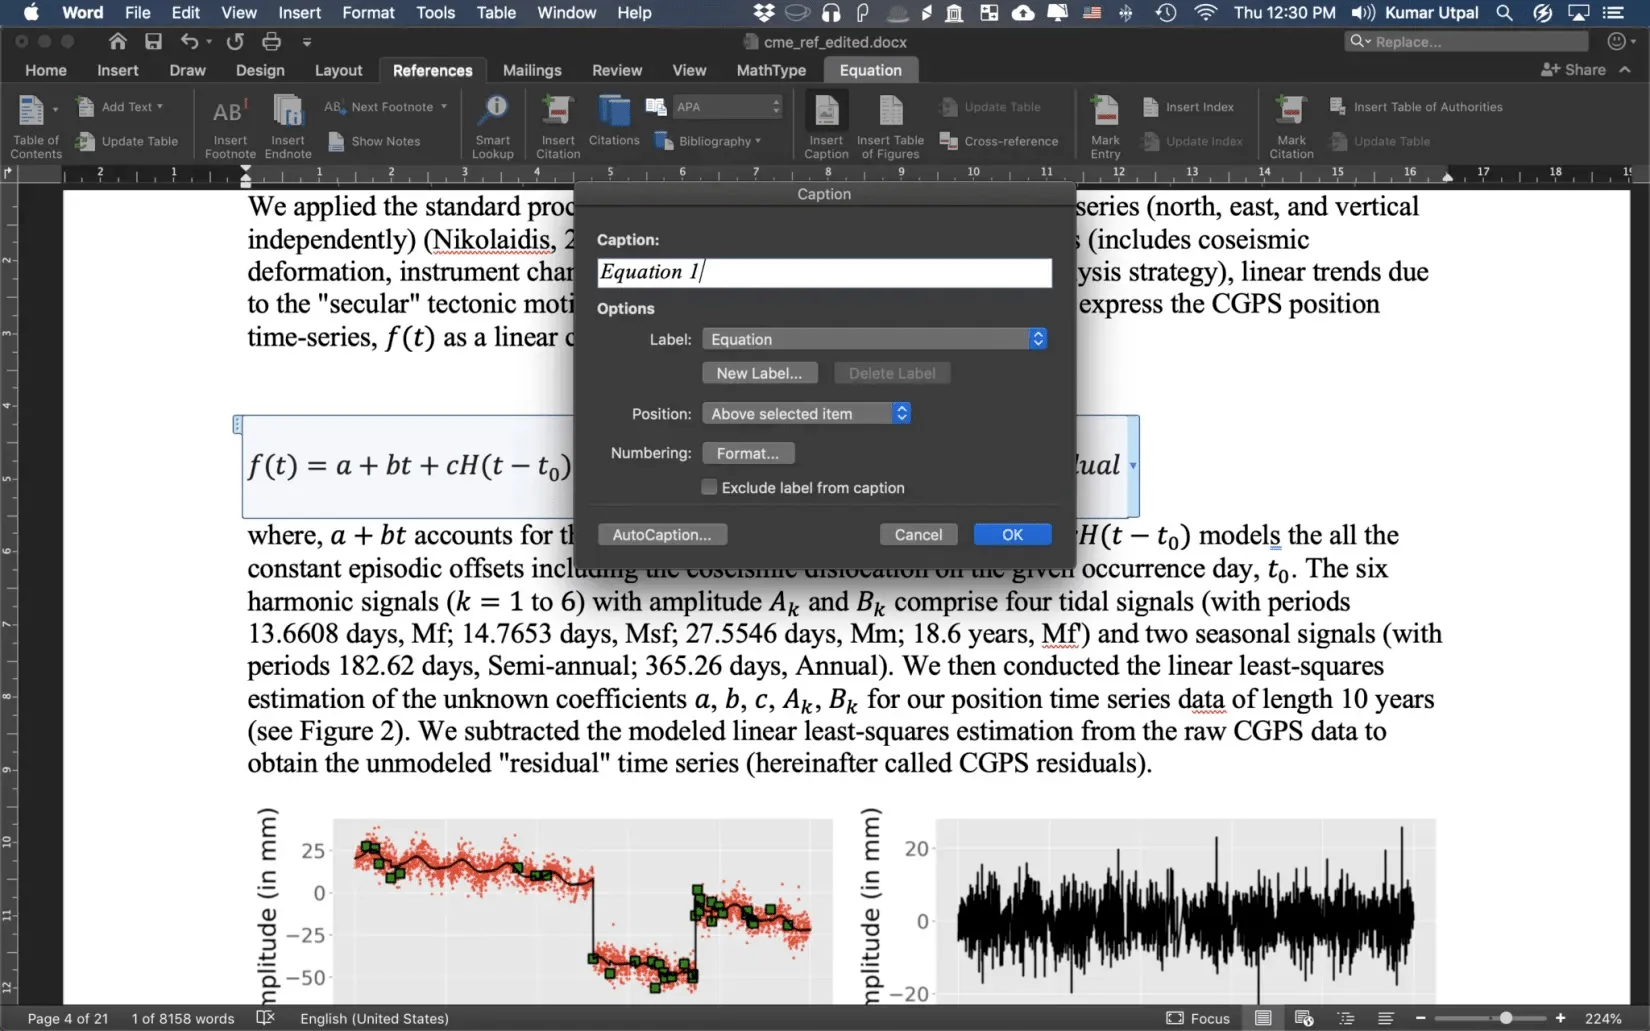
It is essential to insert equation numbers in your thesis and/or any scientific paper. In this post, I will show you some of the easiest ways to insert equat...
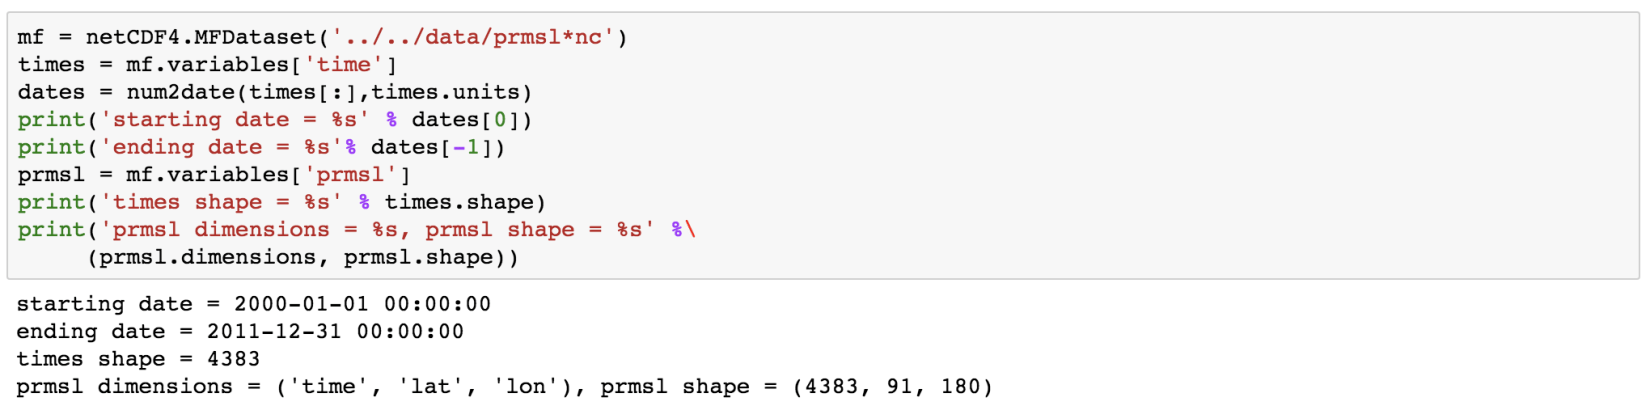
Read a NetCDF file with Python, inspect its dimensions and metadata, select a small region, handle missing values, and decode time coordinates. Includes a re...
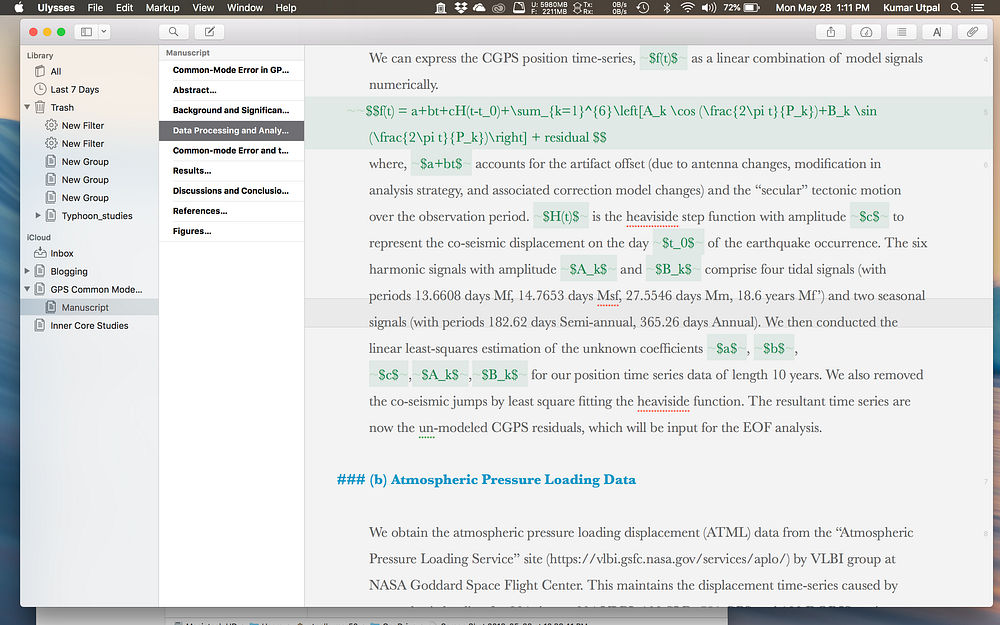
Ulysses is a natural, freestyle way of writing. If you got any idea, just write it down, worry about the format and other things when you’re done. Don’t let ...
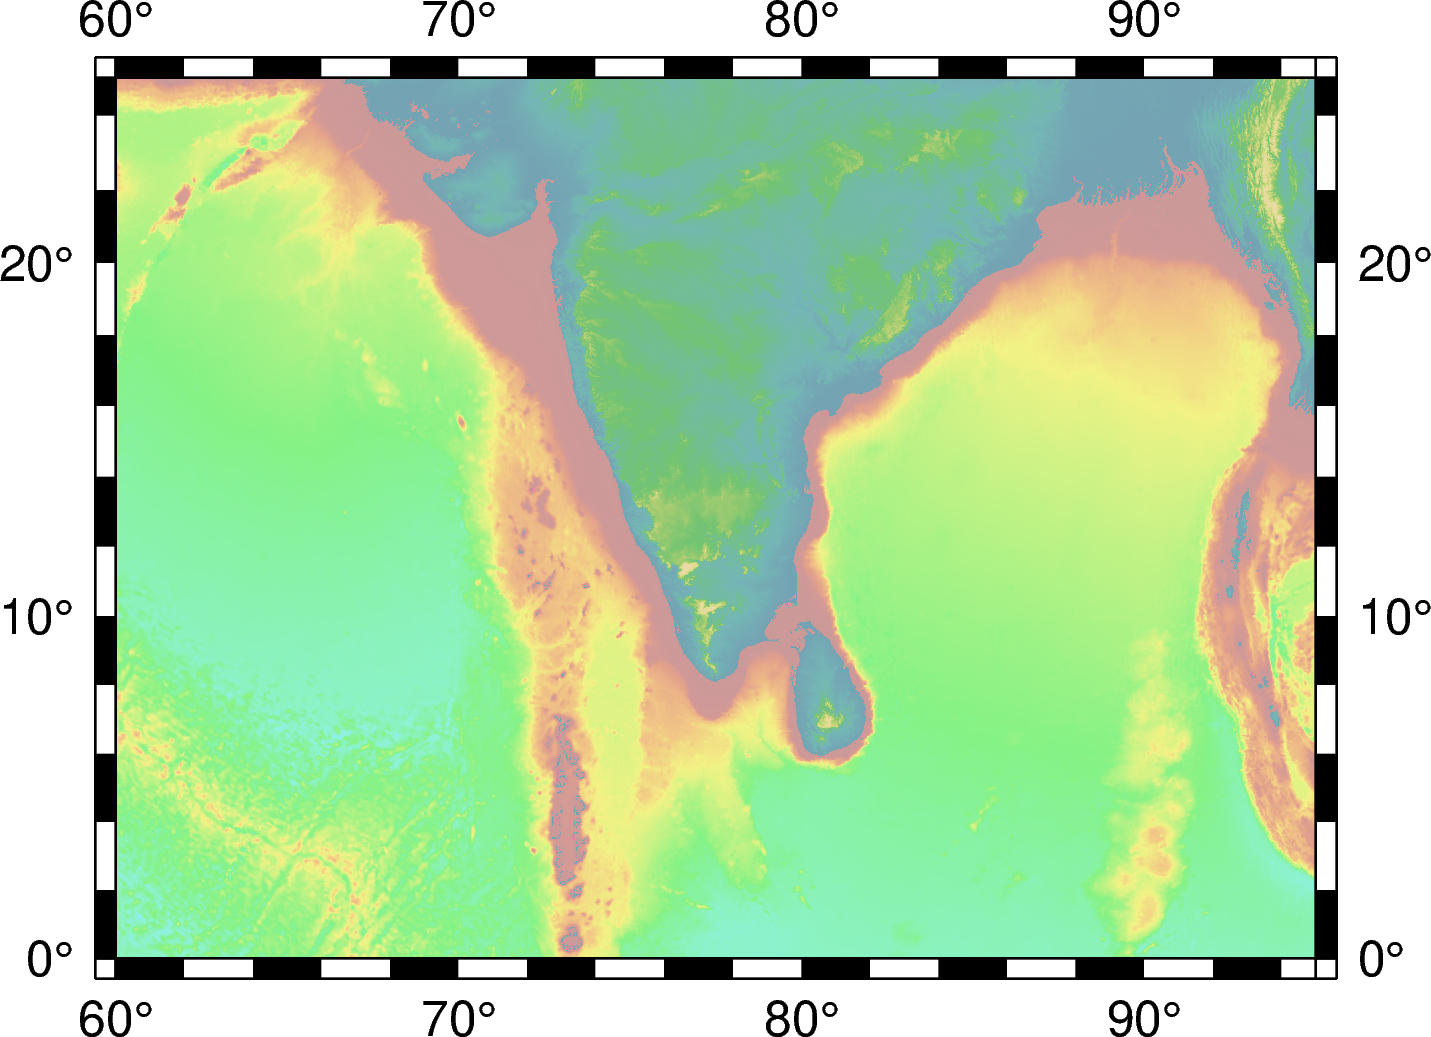
A hands-on tutorial on plotting a high-resolution topographic map in Python with PyGMT — built up one layer at a time, with interactive checks.
Seismic resolution and fidelity are the two important measures of the quality of the seismic record and the seismic images. Seismic resolution quantifies the...
Simple earthquake location problem and its solution using Geiger’s method
Factor Analysis is an exploratory data analysis method used to search influential underlying factors or latent variables from a set of observed variables
This post is aimed to resolve the issues regarding the conflicts of using obspy and basemap libraries together.
Time-series analysis is essential in most fields of science, including geophysics, economics, etc. Most of the geophysical data comes in a time-series format...
The Generic Mapping Tools is widely used across Earth and Planetary and other fields of studies to process data and generate high-quality illustrations. This...
Obspy is an open-source Python framework developed for the processing of seismological data. In this post, I will introduce how to use Obspy along with some ...
We demonstrate how to model a simple wave, obtain its frequencies, apply Hilbert transform, and perform edge detection
Create a reproducible NetCDF file in Python with dimensions, coordinate variables, units, missing values, compression, and correctly stored times. Includes c...
In this post, we will see how we can use Python to low-pass filter the 10 year long daily fluctuations of GPS time series. We need to use the “Scipy” package...
It is essential to insert equation numbers in your thesis and/or any scientific paper. In this post, I will show you some of the easiest ways to insert equat...
Read a NetCDF file with Python, inspect its dimensions and metadata, select a small region, handle missing values, and decode time coordinates. Includes a re...
Ulysses is a natural, freestyle way of writing. If you got any idea, just write it down, worry about the format and other things when you’re done. Don’t let ...
A hands-on tutorial on plotting a high-resolution topographic map in Python with PyGMT — built up one layer at a time, with interactive checks.