Working with Obspy and Basemap (codes included)
Loading likes…
Many people have inquired me regarding the conflicts of using Basemap and Obspy together. The conflicts mostly come with the incompatibility of the matplotlib version used in the relatively newer version of Obspy and the Basemap library. Please note that the Basemap library is no longer supported and the readers are recommended to migrate to other libraries for plotting such as Cartopy or pyGMT. However, these libraries are still under development so it is understandable if readers want to stick with the Basemap for the time being.
This post do not claim to solve the issues but it shows a way to work with the two together.
Key idea — data and map are separate jobs. ObsPy supplies the seismic data and metadata (stations from an Inventory, events from a Catalog); a separate mapping library draws them on a geographic projection. This post pairs ObsPy with Basemap, but that pairing is the hard part precisely because Basemap is frozen in time. The clean split still holds with any backend: get the metadata → choose a projection → scatter the stations/events → annotate. Just swap the mapping tool for a maintained one.
Basemap is end-of-life — this is a legacy workflow. matplotlib’s Basemap toolkit was deprecated in 2020 and is no longer maintained; it lags modern matplotlib, which is the very “conflict” this post works around. More importantly, ObsPy itself removed its Basemap map backend — the changelog reads “removed basemap, now only cartopy is supported for maps” — so the fig.bmap = m / inv.plot(fig=fig) pattern below no longer runs on current ObsPy. On a fresh setup, use Cartopy (ObsPy’s built-in .plot() uses it automatically now) or PyGMT. The code here is kept as a historical reference for anyone maintaining an old Basemap environment.
Installing Anaconda environment for Obspy and Basemap
Basemap is easy to install using Anaconda, so I most often take this path. I will start by creating a “Python 3.6” anaconda environment. Why Python 3.6? Well, I know that it works. The reader is advised to explore the newer version of Python.
You can download my installation of this environment from here. For installing the environment from the downloaded obsbase.yml file, run:
conda env create -f obsbase.yml
For step by step installation, follow:
conda create -n obsbase python=3.6
Then activate the obsbase environment.
conda activate obsbase
After that I will install Basemap first so that libraries which comes next (Obspy in this case) try first to resolve conflicts with Basemap if any or install the compatible version.
conda install -c conda-forge basemap
Then I install Obspy:
conda install -c conda-forge obspy
Now, we have the working version of both Obspy and Basemap. Let’s test it.
Download seismic stream using Obspy and remove instrument response
I use this script because it can possibly throw Attribute Error with numpy.fft.fftpack when removing the response of the stream.
In my case, it runs just fine.
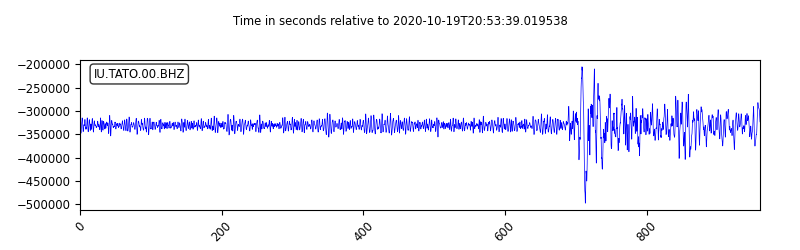
1 Trace(s) in Stream:
IU.TATO.00.BHZ | 2020-10-19T20:53:39.019538Z - 2020-10-19T21:09:38.969538Z | 20.0 Hz, 19200 samples
Plot with the help of Basemap
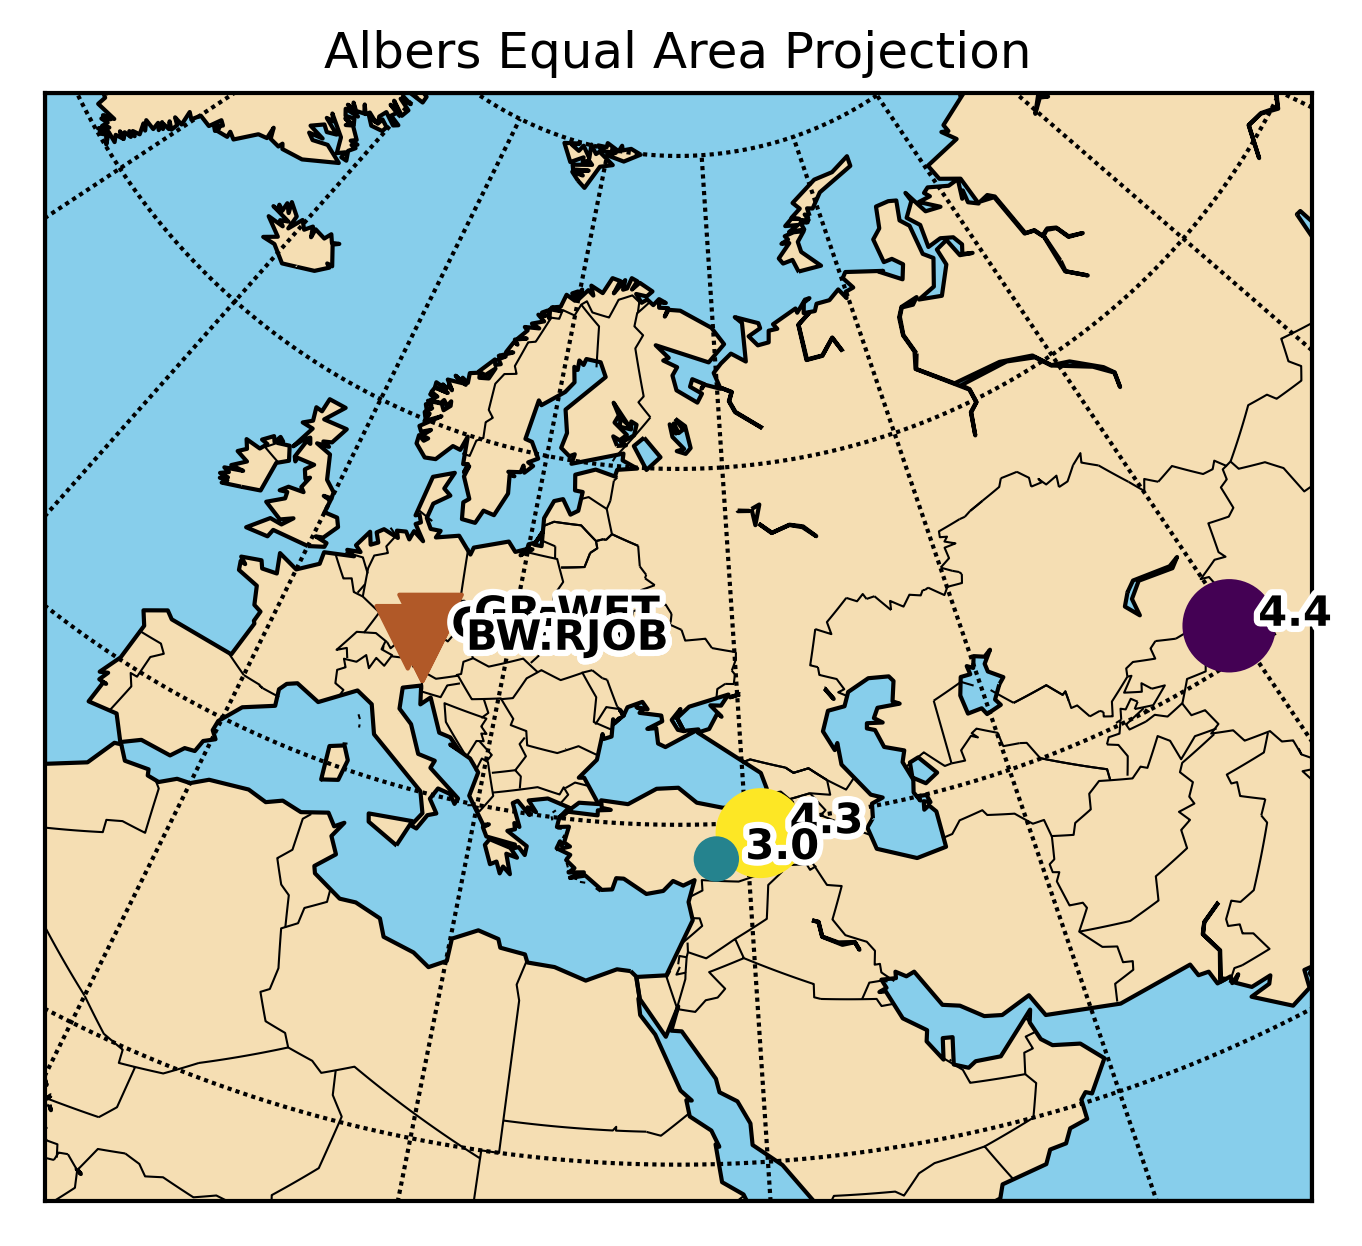
Now, let us run an example basemap script with Obspy. I copied this script from the Obspy tutorial for the quick test. (The original Basemap-beachballs example page has since been retired from the ObsPy docs along with Basemap support.)
from mpl_toolkits.basemap import Basemap
import numpy as np
import matplotlib.pyplot as plt

from obspy import read_inventory, read_events

# Set up a custom basemap, example is taken from basemap users' manual
fig, ax = plt.subplots()

# setup albers equal area conic basemap
# lat_1 is first standard parallel.
# lat_2 is second standard parallel.
# lon_0, lat_0 is central point.
m = Basemap(
   width=8000000,
   height=7000000,
   resolution="c",
   projection="aea",
   lat_1=40.0,
   lat_2=60,
   lon_0=35,
   lat_0=50,
   ax=ax,
)
m.drawcoastlines()
m.drawcountries()
m.fillcontinents(color="wheat", lake_color="skyblue")
# draw parallels and meridians.
m.drawparallels(np.arange(-80.0, 81.0, 20.0))
m.drawmeridians(np.arange(-180.0, 181.0, 20.0))
m.drawmapboundary(fill_color="skyblue")
ax.set_title("Albers Equal Area Projection")

# we need to attach the basemap object to the figure, so that obspy knows about
# it and reuses it
fig.bmap = m

# now let's plot some data on the custom basemap:
inv = read_inventory()
inv.plot(fig=fig, show=False)
cat = read_events()
cat.plot(fig=fig, show=False, title="", colorbar=False)

plt.savefig("basemap_catalog_plot.png", dpi=300, bbox_inches="tight")
Quick check: You set up a fresh Python environment today and want to plot an ObsPy Inventory on a map. Why won’t the fig.bmap = m / Basemap approach above work?
- ObsPy no longer reads inventories
- ObsPy removed its Basemap map backend — it now uses Cartopy, so you’d use Cartopy (or PyGMT) instead
- Basemap only works on Windows now
- You must pay for a Basemap license
Recap
- The friction in this post is a version conflict: modern ObsPy needs a newer matplotlib than the frozen Basemap toolkit supports, so they must be pinned together in one careful conda environment.
- Basemap is end-of-life (deprecated 2020, unmaintained), and ObsPy has since dropped its Basemap backend — the map code here is legacy.
- The mental model still transfers: ObsPy provides the data/metadata; a mapping library provides the projection and drawing.
read_inventory()andread_events()(with no arguments) load ObsPy’s bundled example data — handy for testing. - On any current setup, reach for Cartopy (what ObsPy’s
.plot()now uses under the hood) or PyGMT for publication-quality maps.
Where to go next
- PyGMT: high-resolution topographic maps in Python — the modern, maintained mapping path.
- Getting started with ObsPy for seismologists — inventories, catalogs, and streams from scratch.
- Plotting a record section with ObsPy — another way to visualize station data.
Found this article useful?
Loading likes…
Disclaimer of liability
The information provided by the Earth Inversion is made available for educational purposes only.
Whilst we endeavor to keep the information up-to-date and correct. Earth Inversion makes no representations or warranties of any kind, express or implied about the completeness, accuracy, reliability, suitability or availability with respect to the website or the information, products, services or related graphics content on the website for any purpose.
UNDER NO CIRCUMSTANCE SHALL WE HAVE ANY LIABILITY TO YOU FOR ANY LOSS OR DAMAGE OF ANY KIND INCURRED AS A RESULT OF THE USE OF THE SITE OR RELIANCE ON ANY INFORMATION PROVIDED ON THE SITE. ANY RELIANCE YOU PLACED ON SUCH MATERIAL IS THEREFORE STRICTLY AT YOUR OWN RISK.
Leave a comment