When Frequency Changes Signal Structural Damage
Loading likes…
A building-monitoring dashboard flags a 3% drop in the first natural frequency the morning after an earthquake. The most important thing you can do with that number is not explain it away. A fall in natural frequency is the earliest, most direct sign a structure gives that it has lost stiffness — and losing stiffness is exactly what cracking, yielding, and loosening connections feel like from the outside. Field studies of real reinforced-concrete buildings show this signature plainly: after damaging earthquakes, their fundamental period lengthens — their frequency falls — and it lengthens more the worse the damage (Vidal et al., 2014).
Yes, other things nudge a frequency too: temperature, humidity, wind, a crowd of occupants, a flaky sensor. We will rule those out, carefully, further down. But treating every unexpected drop as “probably just the weather” is the more dangerous habit. The question worth asking is not “can this be explained away?” It is: my building’s frequency just moved when I did not expect it to — how fast can I confirm whether it is hurt?
The one mental model
A natural frequency is a stiffness gauge. When it shifts unexpectedly — especially downward — the leading explanation is that the structure got softer, and the usual reason a structure gets softer is damage. Flag the shift first; clear the ordinary causes second.
A frequency is a stiffness gauge
For a single vibration mode, the intuition is one square root:
where $f$ is the natural frequency, $k$ is the effective stiffness, and $m$ is the effective mass. It is not a full model of a real building, but it tells you the one thing that matters here: frequency rises and falls with stiffness. Take stiffness away and the note drops.
That is not an abstraction — you hear it every day:
- A guitar string. Tighten it and the pitch climbs; let it go slack and the pitch sags. Tension is the string’s stiffness. A cracking or yielding structural member is a string losing tension: the same mass, less stiffness, a lower note.
- The ring test. Foundry workers tap a cast wheel or bell and listen. A sound part rings bright and high; a cracked one answers with a dull, lower tone. A monitored building is doing the same test on itself, continuously, and reporting the pitch.
So the mechanically interesting cases sort themselves out:
- Lose stiffness — cracking, yielding, connection slip, corrosion-thinned sections, a softening foundation — and the frequency falls. This is the damage signature.
- Add mass — water, snow, stored load — and the frequency also falls, but that cause is usually knowable and reversible.
- Change a boundary condition — a degraded bearing, a support that no longer restrains the way it did — and the effective stiffness shifts; that change is often itself a form of damage.
The word effective is doing real work. A measured mode belongs to the whole structure-plus-foundation-plus-current-conditions system, not to one beam in isolation — which is why the same drop deserves a look at the building and its supports.
The equivalent period $T = 1/f$ is what engineers usually report after earthquakes, and a lower frequency means a longer period. So the headline is simple: stiffness loss lengthens a building’s period, and a lengthening period is a building announcing damage.
The field evidence that a frequency drop means damage
This is not just laboratory intuition; it has been measured on the ground. After the 2011 Lorca earthquake, Vidal et al. (2014) estimated the dynamic properties of real reinforced-concrete buildings from ambient-vibration data — 59 undamaged buildings before the event and 34 damaged buildings after it. The damaged buildings had a distinctly longer fitted fundamental period, and the period grew with the assigned EMS damage grade. Because period and frequency are inverses, this is direct field evidence that a lower fundamental frequency carries real damage information — and that the size of the shift tracks the severity.
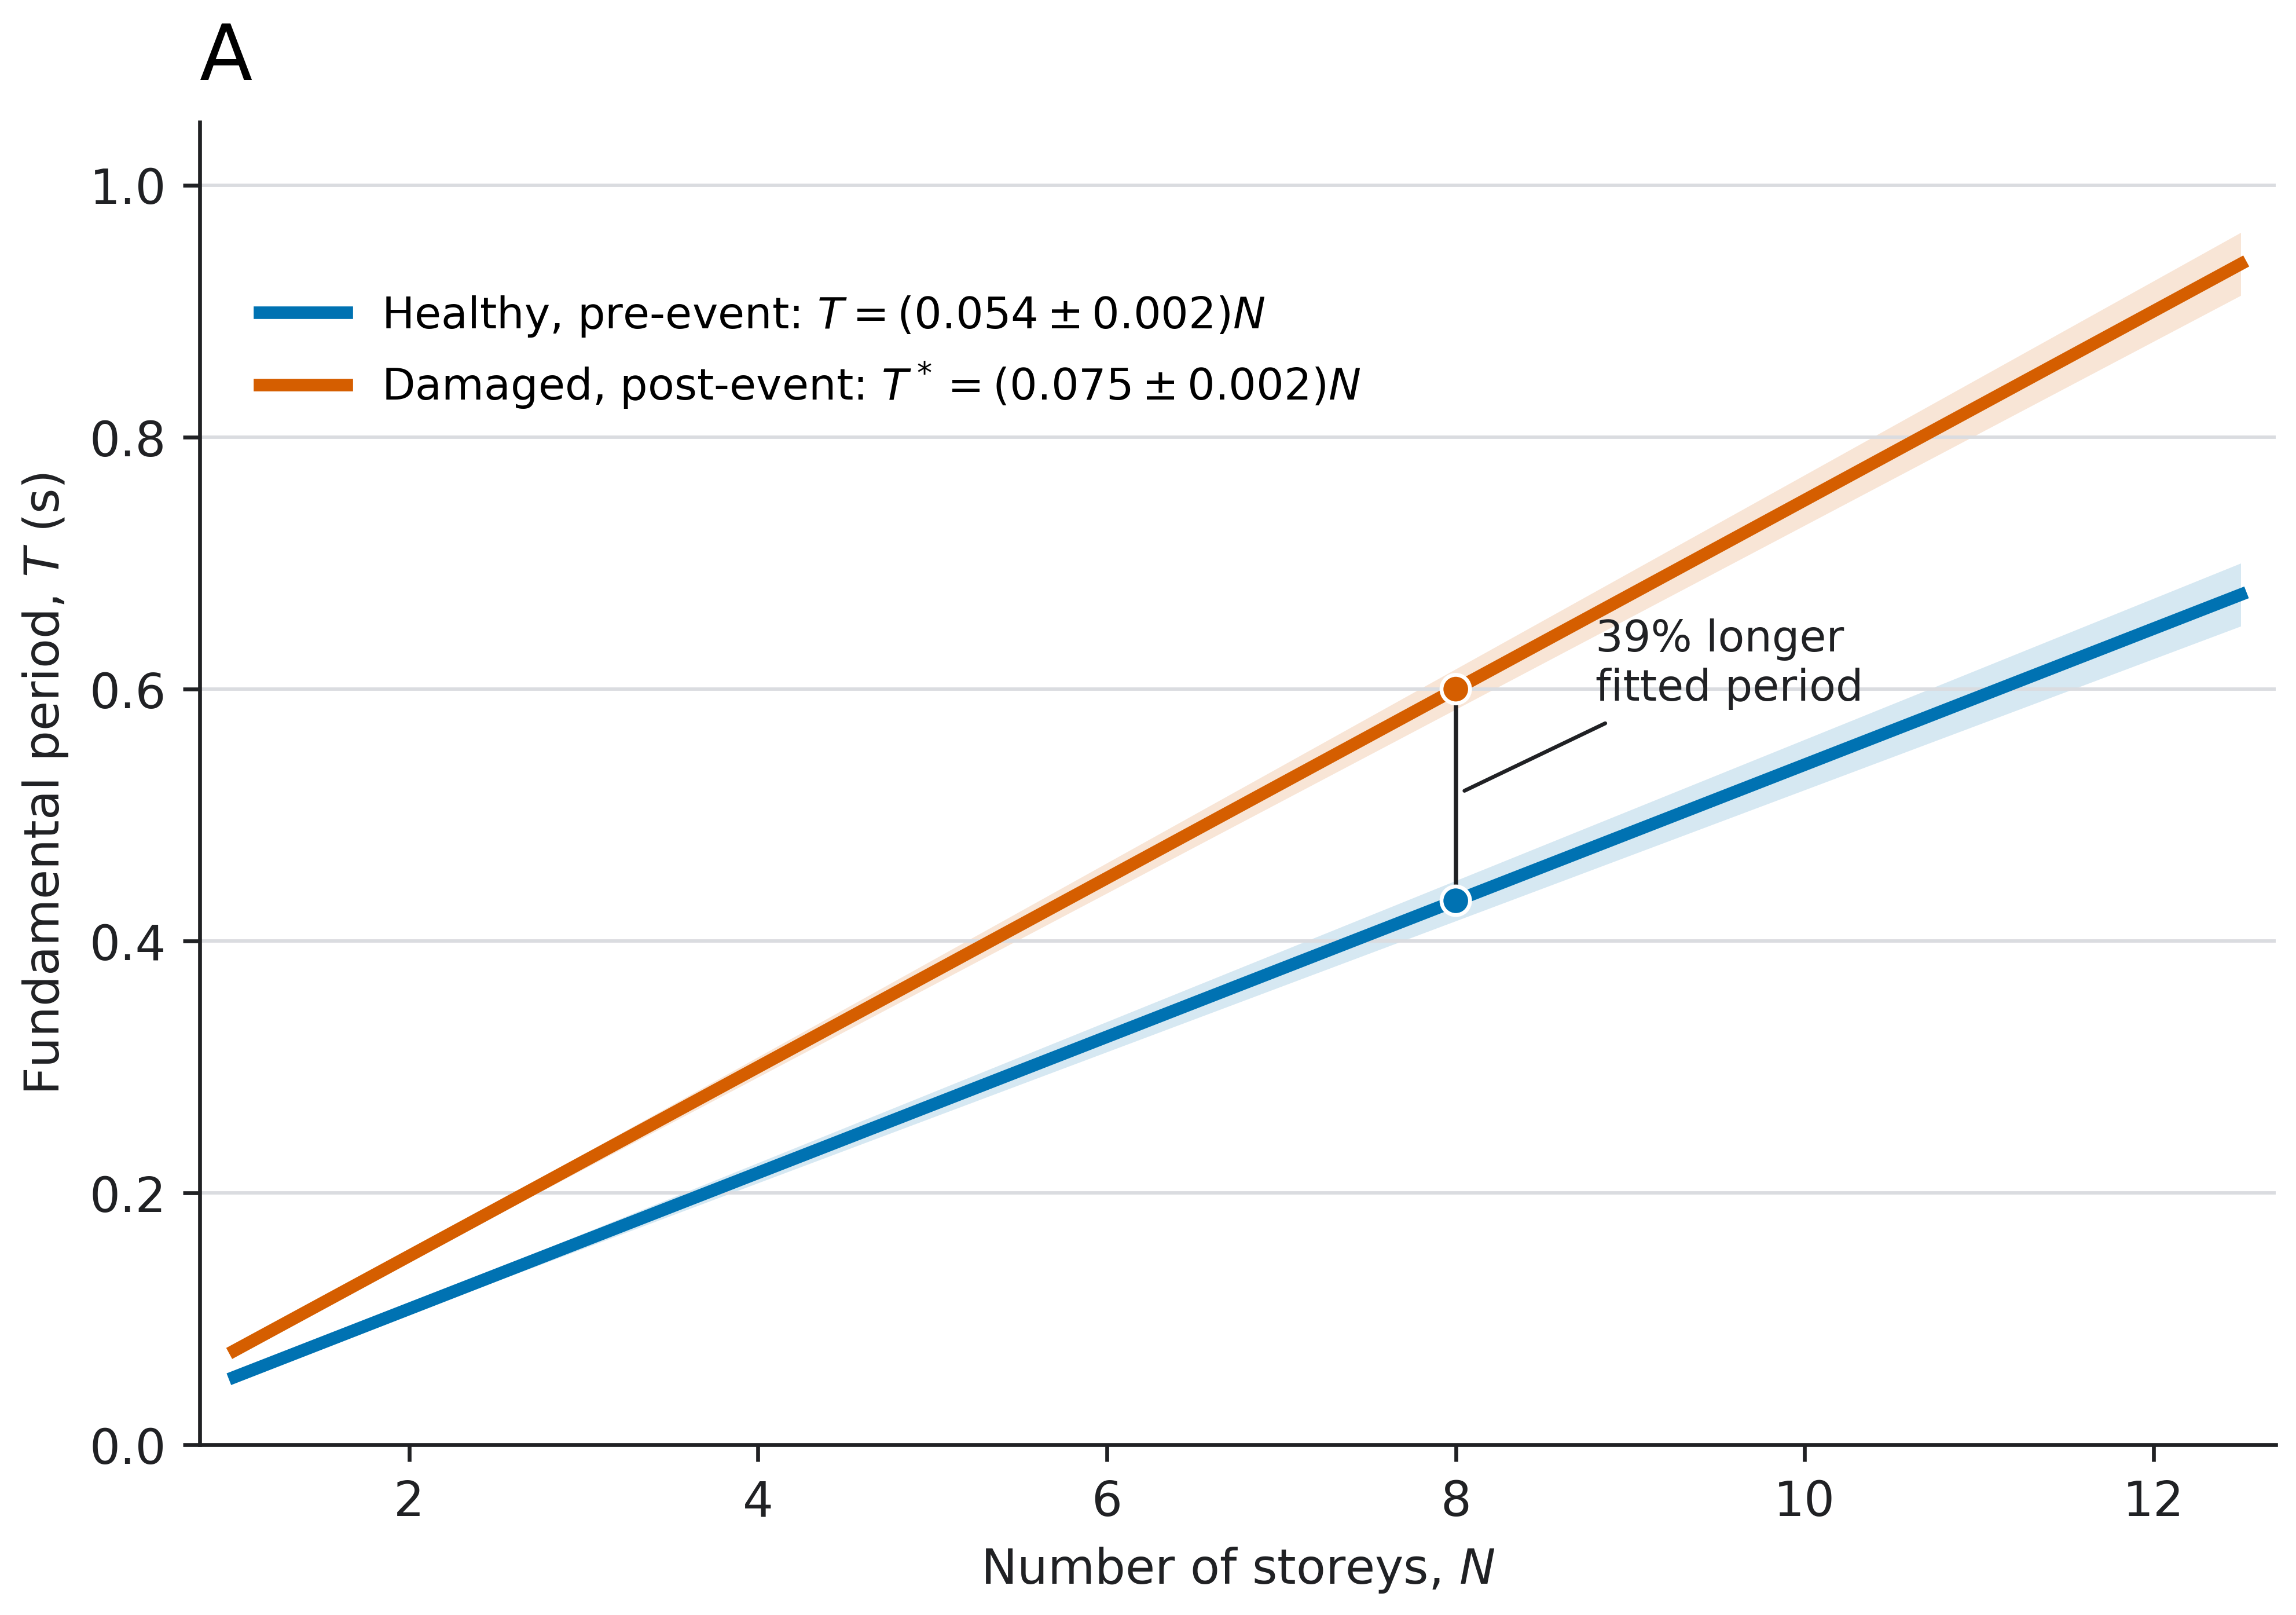
Modern monitoring makes the signal even sharper by not relying on frequency alone. The deconvolution study by Chou et al. (2024) tracks the resonant frequency alongside the traveling-wave velocity through the building and the wave attenuation. In their data the largest changes in velocity and resonant frequency lined up with the most severely damaged buildings — several independent structural clocks slowing down together. The specific magnitudes are context-specific rather than universal thresholds, but the lesson generalizes: when the frequency drop is corroborated by other structural measurements, it becomes a strong, defensible statement about the building’s condition.
A monitored natural frequency drops unexpectedly, right after shaking. What is the right first move?
From an unexpected shift to a confirmed damage case
Flagging the shift is step one, not the verdict. The job now is to turn a suggestive number into a case you would stake an inspection on. Think of it as an evidence ladder, where each rung makes the damage explanation harder to dismiss.
It is like a doctor reading a patient’s chart. A single blood-pressure reading that is off does not diagnose anything — but a reading that stays high across visits, does not track the obvious explanations (you were not just anxious or cold), and lines up with other symptoms is no longer noise. It is a reason to act. A monitored frequency works the same way: the power is not in one number but in a shift that keeps failing to have an innocent explanation.
Try it yourself: is this a damage case?
A building’s first mode sits at 1.00 Hz across a normal year, drifting between 0.98 and 1.02 Hz with the seasons. The morning after a magnitude-6 earthquake it reads 0.95 Hz. Two weeks later — through warm afternoons and cold nights — it is still sitting near 0.95 Hz.
Walk the ladder. The reading is well below the whole seasonal band, so it is not ordinary weather (condition-adjusted). It did not bounce back when conditions changed (persistent). It appeared exactly at the shaking (timed to a plausible cause). That combination is no longer “interesting” — it is the building telling you it is measurably softer than it was, and it warrants inspection.
Now contrast a single 0.97 Hz reading on one cold, wet night that is back to 1.00 Hz by the next afternoon. Same direction, but it fails every test above — a textbook impostor, not a damage case. The skill is not avoiding the alert; it is knowing which alerts to climb the ladder with.
Rule out the impostors — then trust the drop
A building is alive to its surroundings, and a few things really can move a frequency without any damage. Naming them is not a reason to distrust the signal; it is how you make the residual shift worth acting on.
- Temperature changes material stiffness and the restraint at joints, bearings, and facades. The classic Z24 Bridge campaign is famous precisely because temperature swings drove much of the natural frequency variation before any damage was introduced (Peeters & De Roeck, 2001); a broad review by Xia et al. (2012) finds the same for civil structures — real, but structure-dependent in sign and size.
- Water, humidity, and soil shift moisture in concrete and change soil-structure interaction; long-term monitoring of a reinforced-concrete slab tied modal changes to both temperature and humidity (Xia et al., 2006). The foundation is part of the vibrating system, not a fixed clamp.
- Wind, occupancy, and operations change the loading, the effective mass, and the very excitation an operational modal analysis (OMA) sees.
- Sensors and processing — mounting, calibration, a dead channel, a filtering or peak-tracking choice — can move an identified frequency on their own; buildings show documented frequency and damping wandering even under normal conditions (Mikael et al., 2013).
The move is not to throw modal data away, and it is certainly not to shrug off a drop as “probably temperature.” It is to learn the building’s normal envelope so that a shift outside it stands out as the damage signal it usually is.
Warning: An unexpected, post-event frequency drop is a legitimate damage flag. Do not dismiss it as weather or operations until data quality, environmental conditions, persistence, and independent structural features have actually been checked — “it was probably the cold” is a hypothesis to test, not a reason to close the ticket.
Why adjust for temperature before acting on a frequency alarm?
Why a single threshold is not enough — and why that argues for acting sooner
A blunt rule like “alert when frequency falls by 2%” fails in both directions. Set it loose and a cold snap trips it; set it tight and you miss a real but modest loss of stiffness, because a local defect may barely move a global mode and environmental swing can mask the rest (Peeters & De Roeck, 2001; Sohn et al., 2002). The lesson many read from this is “frequency is unreliable.” The better lesson is the opposite: because a genuine early-stage loss can hide inside a small number, you should treat an unexplained shift as a flag to confirm — not wait for a dramatic drop that only arrives once the damage is severe. Frequency-based damage detection has a long track record for exactly this reason: global modal properties respond to the mechanisms that matter — cracking, connection slip, bearing degradation, section loss (Salawu, 1997).
Making the flag trustworthy
Turning a raw shift into a dependable alarm is mostly about knowing “normal” well enough to recognize “not normal”:
- Build a healthy baseline across seasons, operating states, and excitation levels — a baseline from one quiet week is a baseline for one quiet week.
- Regress out the conditions. Fit frequency against temperature and other covariates, then watch the residual, not the raw value. The model need not be fancy to be useful.
- Fuse several features. Multiple frequencies, damping, mode shapes, wave velocity, and sensor-health flags form a far richer signature than one peak — and corroboration is what promotes an alert to a case.
- Set an explicit decision rule. Control charts, novelty scores, and confidence intervals should weigh the cost of an unnecessary inspection against the cost of missing a serious condition — and post-earthquake, that balance leans toward looking.
Machine learning earns its place when “normal” is nonlinear and high-dimensional. An autoencoder trained only on healthy data flags a large reconstruction error as novelty — Wang and Cha (2021) paired one with a one-class support vector machine for exactly this unsupervised detection — provided the training set actually spans the normal environmental range, or the model just learns that a cold morning looks strange. Bayesian and physics-informed models go further, separating hidden environmental state from hidden structural state and returning a probability over competing explanations, with structural dynamics constraining what the model may believe (Cross et al., 2022). And when many sensors or buildings form a connected population, graph neural networks encode those relationships for automated modal analysis at scale (Jian et al., 2025). Underneath all of it is the durable idea from Sohn et al. (2001, 2002): learn normal variability first, then classify condition.
The monitoring system that acts on the flag
The most useful system is not a louder frequency alarm — it is a layered decision process that carries a shift from raw data to an action:
- At the edge: synchronize sensors, reject bad channels, estimate modal features, and keep high-rate evidence around every event.
- In the cloud or control room: fuse vibration with weather, occupancy, equipment state, and image-based inspection.
- In a digital twin: compare against a model that updates as material properties and support conditions evolve.
- For decisions: report a probability, the likely explanations, and a recommended next action — not a binary damaged/not-damaged light.
This is the broader shift in structural health monitoring toward probabilistic inference (Bull et al., 2021), and it fits naturally with modern seismic monitoring, where signal processing, quality control, cloud, and uncertainty already belong together. For a related Earth Inversion example, see how modern monitoring systems turn continuous seismic data into a vetted earthquake catalog.
Takeaway
When a building’s natural frequency drops after shaking, the safe instinct is not “how do I explain this away?” It is “how fast can I confirm the building is intact?” Run the confirmation in order:
- Is the measurement itself trustworthy?
- What were the environmental and operational conditions — and does the shift survive them?
- Has it persisted since the event, rather than recovering with the weather?
- Do independent features — other modes, wave velocity, mode shapes, inspection — tell the same story?
- What one follow-up measurement or inspection would most reduce the remaining uncertainty?
A natural frequency is one of the few things a structure will tell you about its own health, continuously and for free. When it falls unexpectedly, the structure is reporting that it has grown softer — and grown softer is usually how buildings say they are hurt. Flag it, climb the ladder, and let a persistent, corroborated drop do what it is good at: getting an engineer to the building before the next earthquake does.
References
Bull, L. A., Gardner, P., Rogers, T. J., Cross, E. J., Dervilis, N., & Worden, K. (2021). Probabilistic inference for structural health monitoring: New modes of learning from data. ASCE-ASME Journal of Risk and Uncertainty in Engineering Systems, Part A: Civil Engineering, 7(1), Article 03120003. https://doi.org/10.1061/AJRUA6.0001106
Chou, Y.-T., Wen, S., Liao, C.-F., Chen, Y. N., & Kuo, C.-H. (2024). Exploring changes in building strength using seismic wave deconvolution. Terrestrial, Atmospheric and Oceanic Sciences, 35(1), Article 7. https://doi.org/10.1007/s44195-024-00066-6
Cross, E. J., Gibson, S. J., Jones, M. R., Pitchforth, D. J., Zhang, S., & Rogers, T. J. (2022). Physics-informed machine learning for structural health monitoring. In A. Cury, D. Ribeiro, F. Ubertini, & M. D. Todd (Eds.), Structural health monitoring based on data science techniques (pp. 347–367). Springer. https://doi.org/10.1007/978-3-030-81716-9_17
Jian, X., Xia, Y., Duthé, G., Bacsa, K., Liu, W., & Chatzi, E. (2025). Using graph neural networks and frequency domain data for automated operational modal analysis of populations of structures. Data-Centric Engineering, 6, Article e45. https://doi.org/10.1017/dce.2025.10023
Mikael, A., Gueguen, P., Bard, P.-Y., Roux, P., & Langlais, M. (2013). The analysis of long-term frequency and damping wandering in buildings using the random decrement technique. Bulletin of the Seismological Society of America, 103(1), 236–246. https://doi.org/10.1785/0120120048
Peeters, B., & De Roeck, G. (2001). One-year monitoring of the Z24-Bridge: Environmental effects versus damage events. Earthquake Engineering & Structural Dynamics, 30(2), 149–171. https://doi.org/10.1002/1096-9845%28200102%2930:2%3C149::AID-EQE1%3E3.0.CO;2-Z
Salawu, O. S. (1997). Detection of structural damage through changes in frequency: A review. Engineering Structures, 19(9), 718–723. https://doi.org/10.1016/S0141-0296%2896%2900149-6
Sohn, H., Farrar, C. R., Hunter, N. F., & Worden, K. (2001). Structural health monitoring using statistical pattern recognition techniques. Journal of Dynamic Systems, Measurement, and Control, 123(4), 706–711. https://doi.org/10.1115/1.1410933
Sohn, H., Worden, K., & Farrar, C. R. (2002). Statistical damage classification under changing environmental and operational conditions. Journal of Intelligent Material Systems and Structures, 13(9), 561–574. https://doi.org/10.1106/104538902030904
Vidal, F., Navarro, M., Aranda, C., & Enomoto, T. (2014). Changes in dynamic characteristics of Lorca RC buildings from pre- and post-earthquake ambient vibration data. Bulletin of Earthquake Engineering, 12(5), 2095–2110. https://doi.org/10.1007/s10518-013-9489-5
Wang, Z., & Cha, Y.-J. (2021). Unsupervised deep learning approach using a deep auto-encoder with a one-class support vector machine to detect damage. Structural Health Monitoring, 20(1), 406–425. https://doi.org/10.1177/1475921720934051
Xia, Y., Chen, B., Weng, S., Ni, Y.-Q., & Xu, Y.-L. (2012). Temperature effect on vibration properties of civil structures: A literature review and case studies. Journal of Civil Structural Health Monitoring, 2(1), 29–46. https://doi.org/10.1007/s13349-011-0015-7
Xia, Y., Hao, H., Zanardo, G., & Deeks, A. (2006). Long term vibration monitoring of an RC slab: Temperature and humidity effect. Engineering Structures, 28(3), 441–452. https://doi.org/10.1016/j.engstruct.2005.09.001
Found this article useful?
Loading likes…
Disclaimer of liability
The information provided by the Earth Inversion is made available for educational purposes only.
Whilst we endeavor to keep the information up-to-date and correct. Earth Inversion makes no representations or warranties of any kind, express or implied about the completeness, accuracy, reliability, suitability or availability with respect to the website or the information, products, services or related graphics content on the website for any purpose.
UNDER NO CIRCUMSTANCE SHALL WE HAVE ANY LIABILITY TO YOU FOR ANY LOSS OR DAMAGE OF ANY KIND INCURRED AS A RESULT OF THE USE OF THE SITE OR RELIANCE ON ANY INFORMATION PROVIDED ON THE SITE. ANY RELIANCE YOU PLACED ON SUCH MATERIAL IS THEREFORE STRICTLY AT YOUR OWN RISK.
Leave a comment