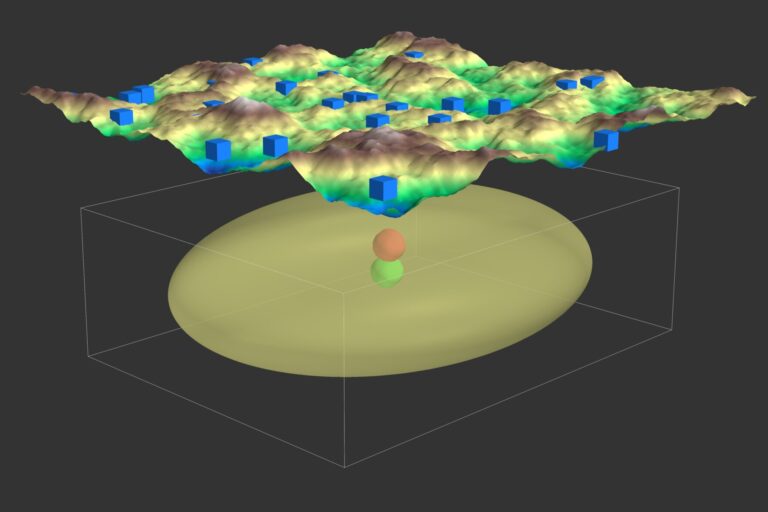
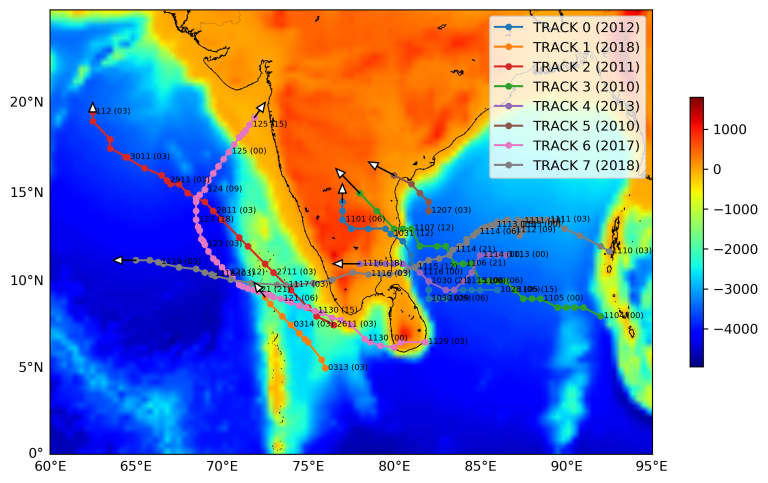
Discover how Genetic Algorithms can be applied to solve the earthquake location problem in seismology. This post walks through generating synthetic seismic data, implementing a GA to estimate earthquake locations, and visualizing results. While effective, the approach has limitations, including simplified assumptions and constraints.
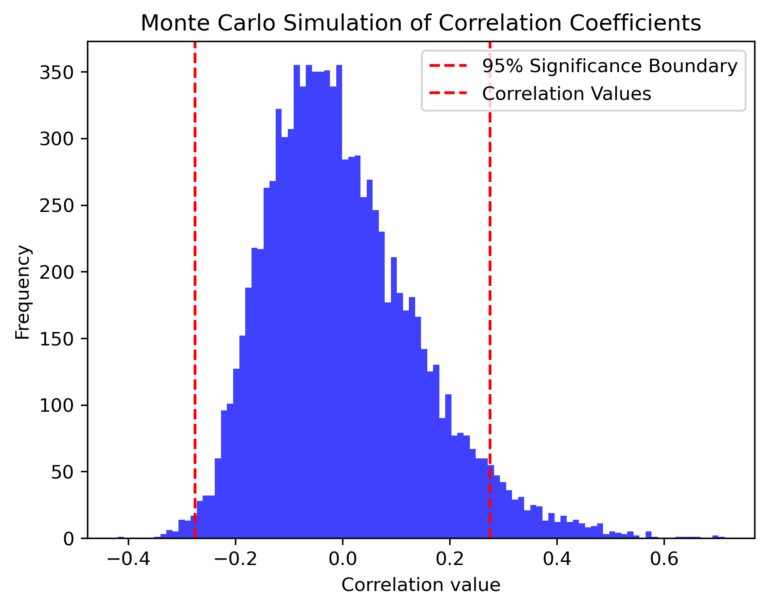
Discover how to test the significance of correlations between datasets using Monte Carlo simulations, with step-by-step implementations in both Python and MATLAB. Learn how to leverage randomization to assess the robustness of your statistical findings.
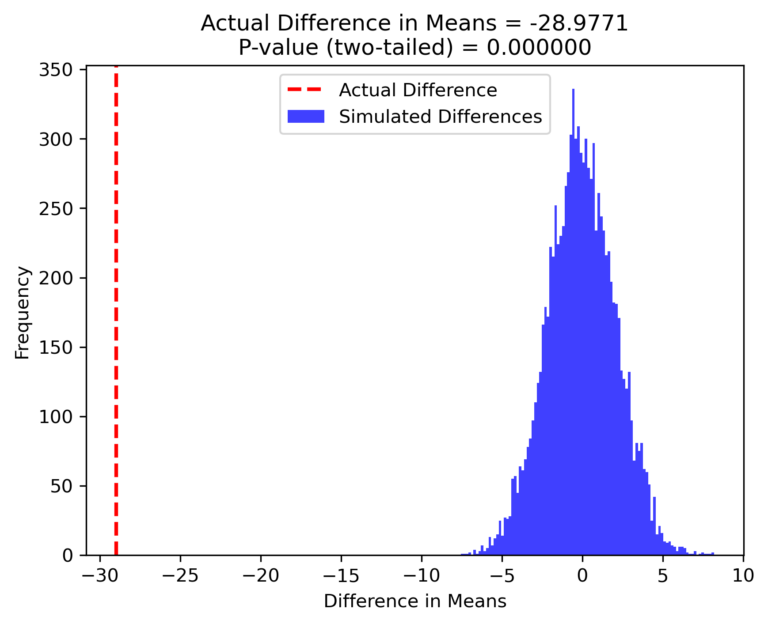
Explore hypothesis testing through randomization and bootstrapping with updated implementations in both Python and MATLAB. Understand the process and visualize results to test the null hypothesis effectively.
Explore the fundamental concepts of Python iterables, iterators, and generators in this comprehensive guide. Learn how to efficiently manage data processing, optimize memory usage, and boost performance in your Python programs through practical examples and detailed explanations.
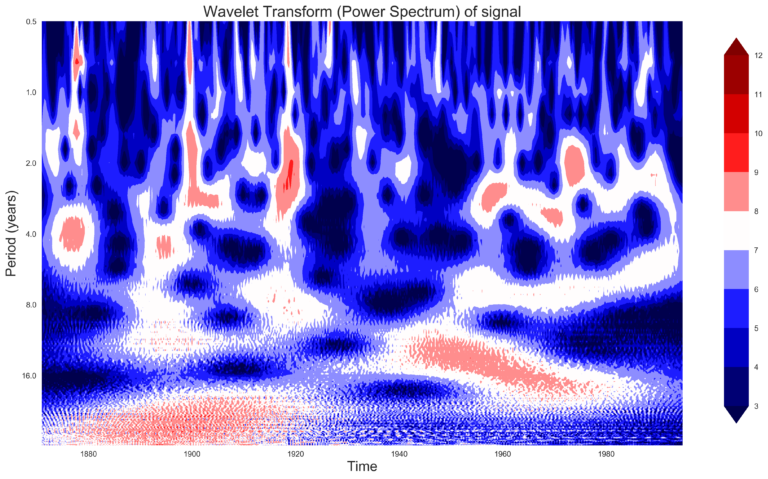
Explore the application of wavelet analysis on real-world geophysical datasets, like ENSO sea surface temperature and Indian monsoon rainfall. This post provides a comparison to Fourier analysis and includes Python code for easy replication.
Parallel computing is essential for handling large datasets efficiently. In this post, we explore Python's threading, multiprocessing, and joblib libraries to speed up code execution. Learn the differences between threading and multiprocessing, and understand how to use joblib for optimized parallel processing, especially with NumPy arrays.
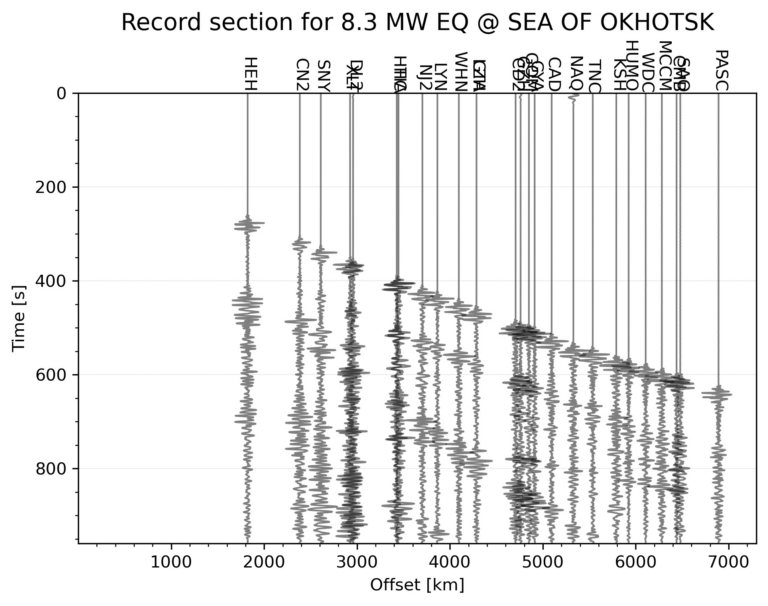
This tutorial demonstrates how to automatically generate a seismic record section for the largest earthquake within a specified time range and geographic area using Python. The process includes downloading seismic data, applying filters, and visualizing the waveforms for interpretation.
Bokeh is a robust Python library for creating interactive, visually appealing web visualizations without requiring JavaScript. It excels in interactivity, integration with web frameworks, customization, and performance. This tutorial covers installation, basic and advanced plotting, styling, data management, and layout configurations, providing a comprehensive guide for data scientists and developers.