In this post, we will first read a CSV file with earthquake locations (latitudes, and longitudes), magnitudes, and depths, and then overlay it on a topographic map. The topographic data are downloaded automatically using PyGMT API.
Read the csv file for events data
I have a csv file containing the earthquake events data. The data is obtained from the PyGMT example dataset. It can be obtained and saved locally:
data = pygmt.datasets.load_japan_quakes()
data.to_csv('my_events_data.csv', index=False)
The data is tabular, so we can read it using the pandas’ read_csv method.
import pandas as pd

# this file is retrieved from the pygmt dataset
data = pd.read_csv('my_events_data.csv')

Plot the data on a topographic map
First, we define the region based on the data.
# Set the region
region = [
    data.longitude.min() - 1,
    data.longitude.max() + 1,
    data.latitude.min() - 1,
    data.latitude.max() + 1,
]
Then we initialize the pygmt “Figure” object:
fig = pygmt.Figure()
Next, we obtain the high-resolution topographic data and plot it using the normalized etopo1 colormap. We set the minimum elevation of -8000 m and a maximum of 5000 m. If there are any topographic regions outside this range then it will be plotted with white. We select the “Mercator” projection with a width of 4 inches for plotting.
# make color pallets
pygmt.makecpt(
    cmap='etopo1',
    series='-8000/5000/1000', #min elevation of -8000m and max of 5000m
    continuous=True
)

# define etopo data file
topo_data = "@earth_relief_30s"
# plot high res topography
fig.grdimage(
    grid=topo_data,
    region=region,
    projection='M4i',
    shading=True,
    frame=True
)
We next plot the coastlines with shorelines, and also added a frame to the map.
fig.coast(shorelines=True, frame=True)
Finally, we plot the data:
# colorbar colormap
pygmt.makecpt(cmap="jet", series=[
              data.depth_km.min(), data.depth_km.max()])
fig.plot(
    x=data.longitude,
    y=data.latitude,
    sizes=0.1*data.magnitude,
    color=data.depth_km,
    cmap=True,
    style="cc",
    pen="black",
)
fig.colorbar(frame='af+l"Depth (km)"')
fig.savefig('my_earthquakes.png')
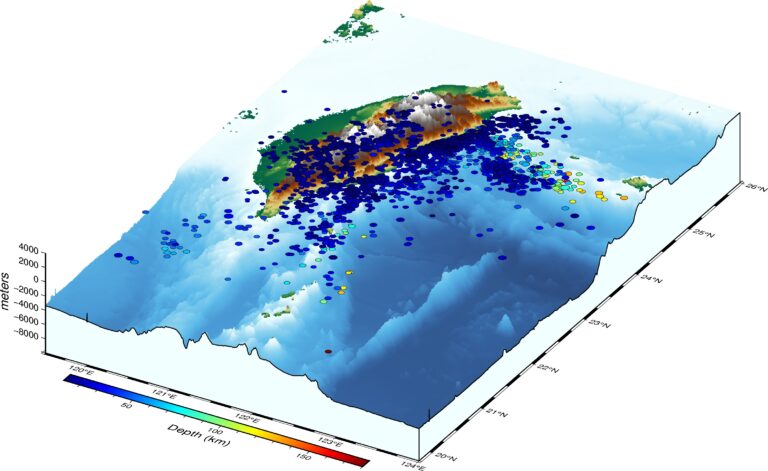
We plot the data with color representing the depths of the earthquakes and the size of the circles representing the magnitudes of the earthquakes. We added the horizontal color bar at the bottom.
import pygmt
import pandas as pd

# Load the data
data = pd.read_csv('my_events_data.csv')

# Set the region
region = [
    data.longitude.min() - 1,
    data.longitude.max() + 1,
    data.latitude.min() - 1,
    data.latitude.max() + 1,
]

fig = pygmt.Figure()

# Create color palette for topography
pygmt.makecpt(
    cmap='etopo1',
    series='-8000/5000/1000',
    continuous=True
)

# Define etopo data file
topo_data = "@earth_relief_30s"

# Plot high-resolution topography
fig.grdimage(
    grid=topo_data,
    region=region,
    projection='M4i',
    shading=True,
    frame=True
)
fig.coast(shorelines=True, frame=True)

# Create color palette for earthquake depths
pygmt.makecpt(cmap="jet", series=[
              data.depth_km.min(), data.depth_km.max()])

# Plot earthquake data
fig.plot(
    x=data.longitude,
    y=data.latitude,
    size=0.1 * data.magnitude,
    fill=data.depth_km,
    cmap=True,
    style="cc",
    pen="black",
)

# Add a colorbar
fig.colorbar(frame='af+l"Depth (km)"')

# Save the figure
fig.savefig('my_earthquakes.png')