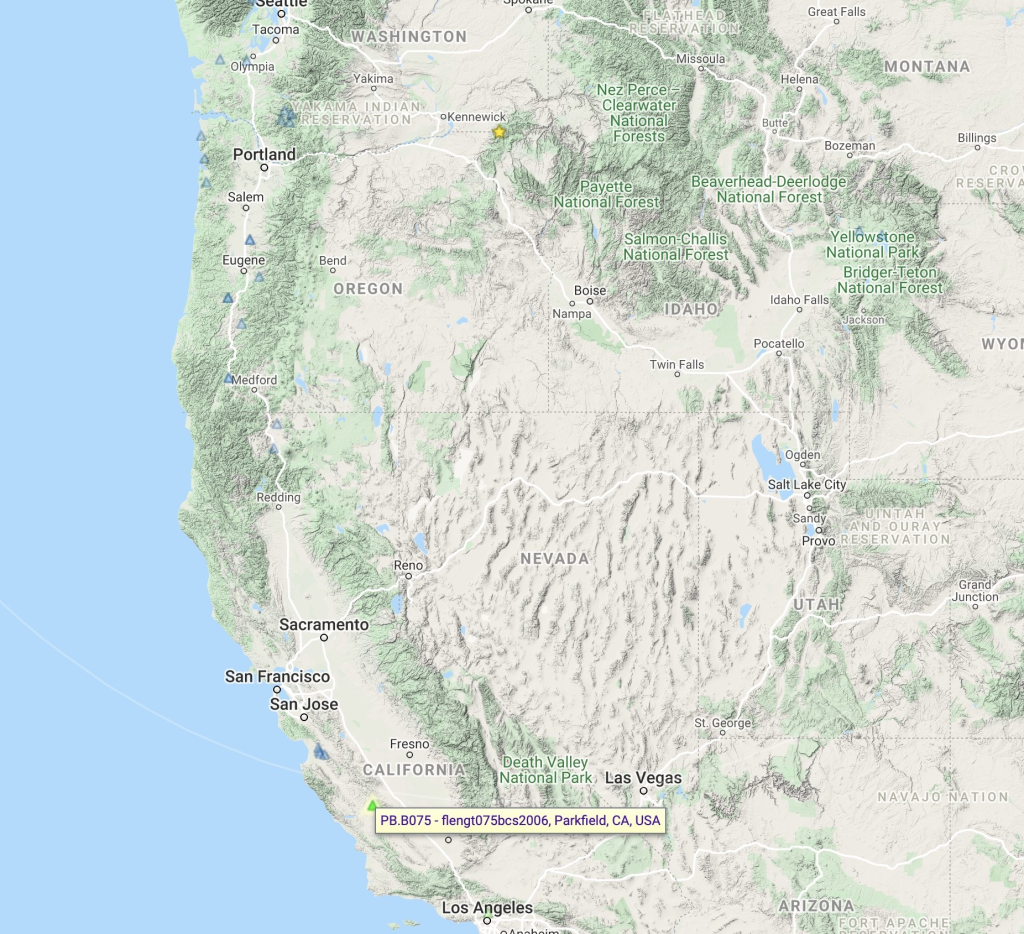
This post demonstrates how to visualize the Power Spectral Density (PSD) of seismic data using the PPSD (Probabilistic Power Spectral Densities) class from the ObsPy library. The example utilizes three days of data from station PB.B075.

1. Import Necessary Libraries
Begin by importing the required libraries:
from obspy.io.xseed import Parser
from obspy.signal import PPSD
from obspy.clients.fdsn import Client
from obspy import UTCDateTime, read_inventory, read
import os, glob
import matplotlib.pyplot as plt
from obspy.imaging.cm import pqlx
import warnings
warnings.filterwarnings('ignore')
2. Download Seismic Data
Set the parameters for the seismic network, station, location, and channel. Define the time range for the data to be downloaded:
## Downloading inventory
net = 'PB'
sta = 'B075'
loc='*'
chan = 'EH*'
filename_prefix = f"{net}_{sta}"
mseedfiles = glob.glob(filename_prefix+".mseed")
xmlfiles = glob.glob(filename_prefix+'_stations.xml')

if not len(mseedfiles) or not len(xmlfiles):
    print("--> Missing mseed / station xml file, downloading...")
    time = UTCDateTime('2008-02-19T13:30:00')
    wf_starttime = time - 60*60
    wf_endtime = time + 3 * 24 * 60 * 60 #3 days of data (requires atleast 1 hour)

    client = Client('IRIS')

    st = client.get_waveforms(net, sta, loc, chan, wf_starttime, wf_endtime)
    st.write(filename_prefix+".mseed", format="MSEED")
    inventory = client.get_stations(starttime=wf_starttime, endtime=wf_endtime,network=net, station=sta, channel=chan, level='response', location=loc)
    inventory.write(filename_prefix+'_stations.xml', 'STATIONXML')
else:
    st = read(filename_prefix+".mseed")
    inventory = read_inventory(filename_prefix+'_stations.xml')
3. Process Data with PPSD
Create a PPSD object for each trace in the stream and add the corresponding data:
tr = st.select(channel="EHZ")[0]
print(st)
st.plot(outfile=filename_prefix+"traces.png",show=False)
ppsd = PPSD(tr.stats, metadata=inventory)
add_status = ppsd.add(st) #add data (either trace or stream objects) to the ppsd estimate
4. Visualize the PSD
Plot the PSD for each PPSD object:
if add_status:
    print(ppsd)
    print(ppsd.times_processed[:2]) #check what time ranges are represented in the ppsd estimate
    print("Number of psd segments:", len(ppsd.times_processed))
    ppsd.plot(filename_prefix+"-ppsd.png",cmap=pqlx) #colormap used by PQLX / [McNamara2004]
    plt.close('all')
    ppsd.plot(filename_prefix+"-ppsd_cumulative.png",cumulative=True,cmap=pqlx) #cumulative version of the histogram
    plt.close('all')
    ppsd.plot_temporal(period=[0.1, 1.0, 10], filename=filename_prefix+"-ppsd_temporal_plot.png") #The central period closest to the specified period is selected
    plt.close('all')
    ppsd.plot_spectrogram(filename=filename_prefix+"-spectrogram.png", show=False)
This will generate plots displaying the power spectral density over time for each channel of the specified station.

Output Figures


References
- Visualizing Probabilistic Power Spectral Densities
- McNamara, D. E., & Buland, R. P. (2004). Ambient Noise Levels in the Continental United States. Bulletin of the Seismological Society of America, 94(4), 1517–1527.
- McNamara, D. E., & Boaz, R. I. (2006). Seismic noise analysis system using power spectral density probability density functions: A stand-alone software package. Citeseer.


