Automatically Plotting a Record Section for an Earthquake in a Given Time Range Using Python
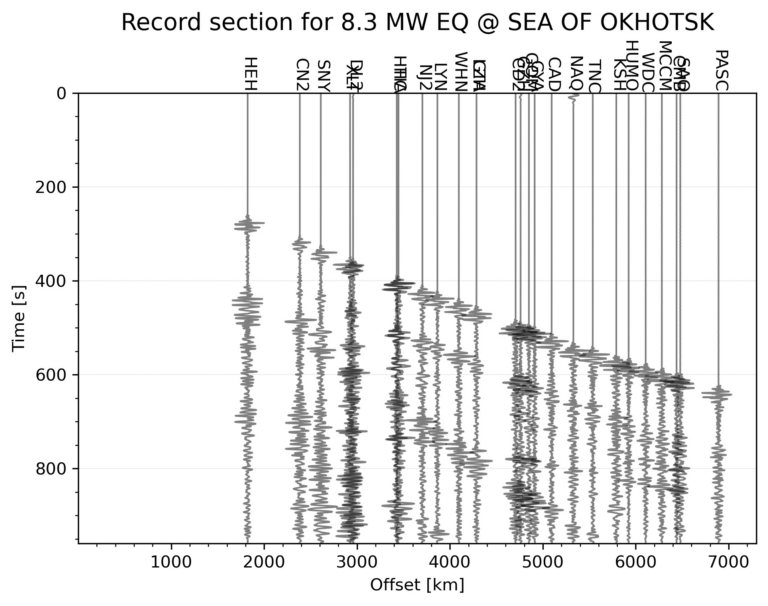
This tutorial demonstrates how to automatically generate a seismic record section for the largest earthquake within a specified time range and geographic area using Python. The process includes downloading seismic data, applying filters, and visualizing the waveforms for interpretation.