Introduction
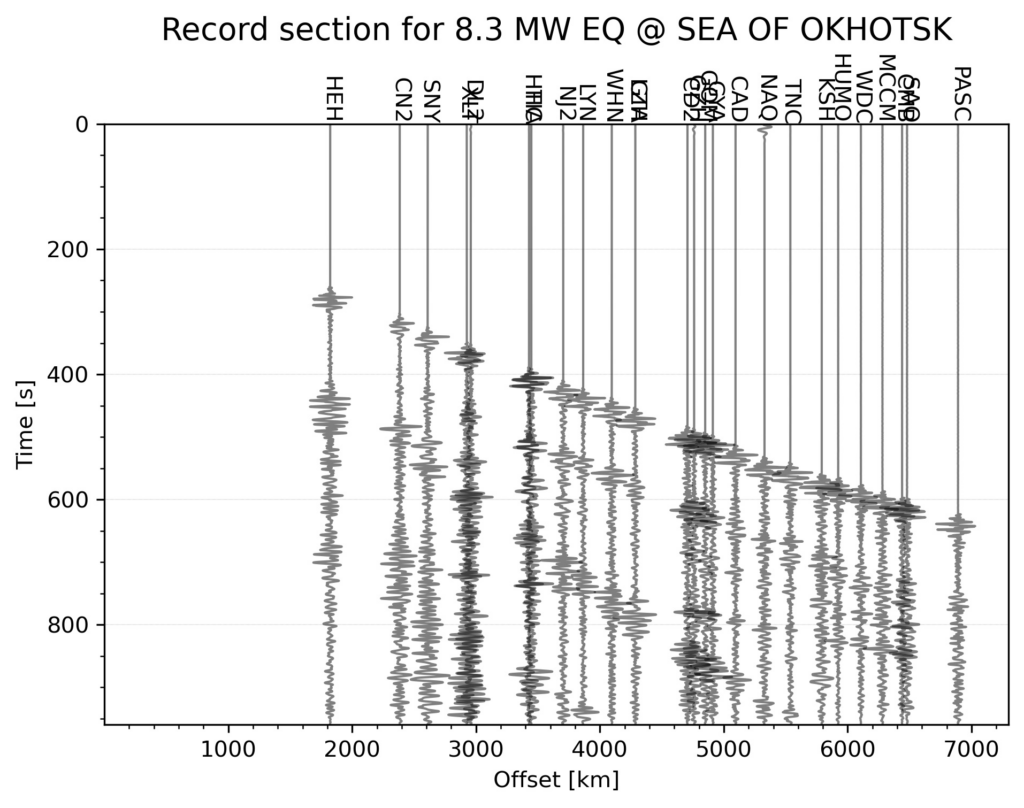
A seismic record section provides a visual representation of multiple seismic records on a single plot. It is a crucial tool in geological interpretation, showing how seismic wave ray paths curve due to increasing velocity with depth. Typically, the further a station is from the earthquake event, the deeper the corresponding ray travels into the Earth.
This tutorial explains how to automatically generate a record section for the largest earthquake event within a specified time range and geographical region using Python.
You can download the complete code from the GitHub repository.
Features:
- Automatically plots a record section for the largest earthquake within a specified time and geographic range.
- User-defined parameters for filtering events and stations.
- Produces waveform and record section plots.
Input Configuration
Define the input parameters in a YAML file (input_file.yml):
minlat: -89
maxlat: 89
minlon: -180
maxlon: 180
starttime: "2013-01-01T00:00:00"
endtime: "2014-01-01T01:00:00"
minmagnitude: 4
maxmagnitude: 9
resultsLoc: "results/"
client_name: IRIS
channel: BHZ
location: "00,01"
offset_min: 1000  # Minimum offset in meters for plotting
rem_response: True  # Remove instrument response
max_num_trace_to_plot: 9999  # Maximum number of traces to display
record_section_relative_beg_time: 60
record_section_relative_end_time: 900
maxDist: 10000000  # Maximum distance (in meters) for traces
filter_trace: True
bandpass_filter:
  freqmin: 0.1
  freqmax: 5
Steps to Run:
- Define parameters in
input_file.yml. - Run the Python script
plot_record_section.pyto plot the record section.
Code Walkthrough
import os
import yaml
import numpy as np
import pandas as pd
import matplotlib.pyplot as plt
from obspy import UTCDateTime, read
from obspy.geodetics import gps2dist_azimuth
from obspy.clients.fdsn import Client
from obspy.core import Stream
from matplotlib.transforms import blended_transform_factory
import warnings

warnings.filterwarnings('ignore')

# Function to extract earthquake catalog information and save it as a CSV
def extract_catalog_info_to_txt(catalog, output_file):
    event_list = []
    for event in catalog:
        try:
            origin = event.origins[0]
            magnitude = event.magnitudes[0]
            description = event.event_descriptions[0].text if event.event_descriptions else "N/A"
            event_data = {
                "eventTime": str(origin.time),
                "eventLat": origin.latitude,
                "eventLon": origin.longitude,
                "eventDepth": origin.depth / 1000,
                "eventMag": magnitude.mag,
                "magType": magnitude.magnitude_type,
                "description": description
            }
            event_list.append(event_data)
        except Exception as e:
            print(f"Error processing event: {e}")

    df = pd.DataFrame(event_list).sort_values(by="eventMag", ascending=False)
    df.to_csv(output_file, index=False)
    return df

# Load input parameters from YAML file
with open('input_file.yml') as f:
    config = yaml.safe_load(f)

# Define required variables from config
minlat, maxlat = config['minlat'], config['maxlat']
minlon, maxlon = config['minlon'], config['maxlon']
starttime, endtime = config['starttime'], config['endtime']
minmagnitude, maxmagnitude = config['minmagnitude'], config['maxmagnitude']
resultsloc = config['resultsLoc']
client_name, channel = config['client_name'], config['channel']
location = config['location']
beg_time, end_time = config['record_section_relative_beg_time'], config['record_section_relative_end_time']

# Output file paths
catalogtxt = os.path.join(resultsloc, 'events.txt')

# Fetch earthquake catalog
client = Client(client_name)
try:
    catalog = client.get_events(starttime=UTCDateTime(starttime), endtime=UTCDateTime(endtime),
                                minlatitude=minlat, maxlatitude=maxlat,
                                minlongitude=minlon, maxlongitude=maxlon,
                                minmagnitude=minmagnitude, maxmagnitude=maxmagnitude)
except Exception as e:
    print(f"Error fetching catalog: {e}")

# Write catalog to CSV and extract top earthquake information
df = extract_catalog_info_to_txt(catalog, catalogtxt)

# Select largest earthquake
eq = df.iloc[0]
origin_time = UTCDateTime(eq['eventTime'])
wf_starttime = origin_time - beg_time
wf_endtime = origin_time + end_time
evLat, evLon = eq['eventLat'], eq['eventLon']

# Fetch station information
try:
    inventory = client.get_stations(startbefore=wf_starttime, endafter=wf_endtime,
                                    minlatitude=minlat, maxlatitude=maxlat,
                                    minlongitude=minlon, maxlongitude=maxlon,
                                    channel=channel, location=location)
except Exception as e:
    print(f"Error fetching stations: {e}")

# Download waveforms for the selected event
st = Stream()
for network, station in zip(inventory.networks, inventory.networks[0].stations):
    try:
        dist, _, _ = gps2dist_azimuth(evLat, evLon, station.latitude, station.longitude)
        if dist < config['maxDist']:
            waveform = client.get_waveforms(network.code, station.code, location, channel,
                                            wf_starttime, wf_endtime, attach_response=True)
            st += waveform
            print(f"Downloaded waveform for station {station.code}")
    except Exception as e:
        print(f"Error fetching waveform for station {station.code}: {e}")

# Apply filters and plot
if config['filter_trace']:
    st.filter('bandpass', freqmin=config['bandpass_filter']['freqmin'],
              freqmax=config['bandpass_filter']['freqmax'])

# Remove instrument response
if config['rem_response']:
    st.remove_response(output='DISP')

# Save waveform and plot record section
st.write(os.path.join(resultsloc, f"stream_{origin_time}.mseed"), format='MSEED')

fig = plt.figure()
st.plot(type='section', dist_degree=False, time_down=True, offset_min=config['offset_min'], fig=fig)
plt.title(f"Record Section for {eq['eventMag']} {eq['magType']} Earthquake")
plt.savefig(os.path.join(resultsloc, f"record_section_{origin_time}.png"), dpi=300)
plt.close(fig)
Running the Script
- Install dependencies:
- Install required packages using one of the following:
conda install --name myenv --file spec-file.txt conda env create -f environment.yml
- Install required packages using one of the following:
- Run the script:
python plot_record_section.py
