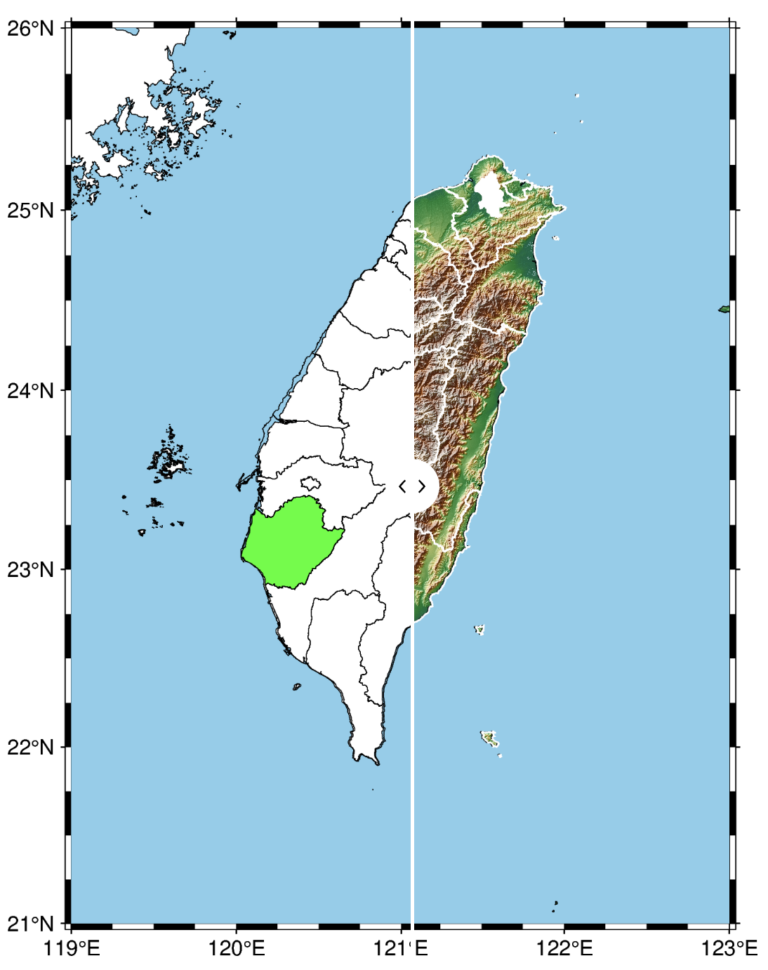
Building upon the previous post on plotting the topographic map in Python, this time we add shading in the plot to generate Generic Mapping Tools (GMT) kind of plot in Python. In this way, we can rely on all the ease and dynamics of Python and still get the GMT type of plot.
The function for plotting the shaded relief map used in the following code can be downloaded and saved from here.
from plotting_topo import plot_topo, plot_topo_netcdf
from mpl_toolkits.basemap import Basemap
import matplotlib.pyplot as plt
import numpy as np
import pandas as pd

stn_df = pd.read_csv('statlist2.txt',header=None,sep='\s+',names=['net','sta','lat','lon','ele'])


etopo_file = "/Users/utpalkumar50/Documents/bin/ETOPO1_Bed_g_gmt4.grd"

lonmin, lonmax = 119.5,122.5
latmin, latmax = 21.5,25.5
if stn_df['lat'].min()<latmin or stn_df['lat'].max()>latmax or stn_df['lon'].min()<lonmin or stn_df['lon'].max()>lonmax:
    print("GEOGRAPHICAL RANGE ERROR: Stations outside the range")

else:
    networkset = set([val for val in stn_df['net']])
    stations = [val for val in stn_df['sta']]
    color=iter(plt.cm.jet(np.linspace(0,1,len(networkset))))
    netcolor = {net:c for net, c in zip(networkset, color)}

    fig = plt.figure(figsize=(10,6))
    ax = fig.add_subplot(111)
    map = Basemap(projection='merc',resolution = 'f', area_thresh = 10000., llcrnrlon=lonmin, llcrnrlat=latmin,urcrnrlon=lonmax, urcrnrlat=latmax)
    cs = plot_topo_netcdf(map,etopo_file=etopo_file,cmap=plt.cm.terrain,lonextent=(lonmin, lonmax),latextent=(latmin, latmax),zorder=2)
    fig.colorbar(cs, ax=ax, shrink=0.8)
    map.drawcoastlines(color='k',linewidth=1,zorder=3)
    map.drawcountries(color='k',linewidth=1,zorder=3)

    parallelmin,parallelmax = int(latmin), int(latmax)+1
    map.drawparallels(np.arange(parallelmin, parallelmax+1,0.5).tolist(),labels=[1,0,0,0],linewidth=0,fontsize=6)
    meridianmin,meridianmax = int(lonmin),int(lonmax)+1
    map.drawmeridians(np.arange(meridianmin, meridianmax+1,0.5).tolist(),labels=[0,0,0,1],linewidth=0,fontsize=6)
    map.drawmapboundary(color='k', linewidth=2, zorder=1)

    for lon, lat, sta, net in zip(stn_df['lon'],stn_df['lat'],stn_df['sta'],stn_df['net']):
        x,y = map(lon, lat)
        plt.text(x+28000, y, sta, ha="center", va="center",fontsize=10)
        map.plot(x, y,'^',color=netcolor[net], markersize=10,markeredgecolor='k',linewidth=0.1,markeredgewidth=0.1,zorder=3)
    for net in networkset:
        map.plot(np.NaN,np.NaN,'^',color=netcolor[net],label=net, markersize=10,markeredgecolor='k',linewidth=0.1,markeredgewidth=0.1)
    plt.legend(loc=4,fontsize=8)
    plt.savefig('station_map.png',bbox_inches='tight',dpi=600)
    plt.close('all')
- Properly set your station file, statlist2.txt.
- Set the path to the etopo file downloaded from NOAA website.
- Save the above code as plot_stations.py and execute the code in terminal:
python plot_stations.py