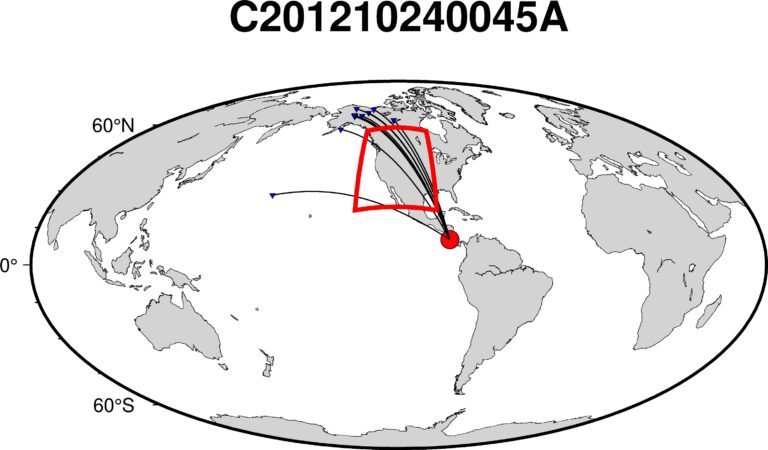
How to plot great circle path through your region using PyGMT

In this article, we will learn how to visualize the great circle paths that traverse a designated region of interest using PyGMT. Understanding these paths is crucial for rigorous seismic tomography investigations, as they can provide insights into the subsurface structure below the select region of interest.
