How to overlay shapefile data on PyGMT Maps
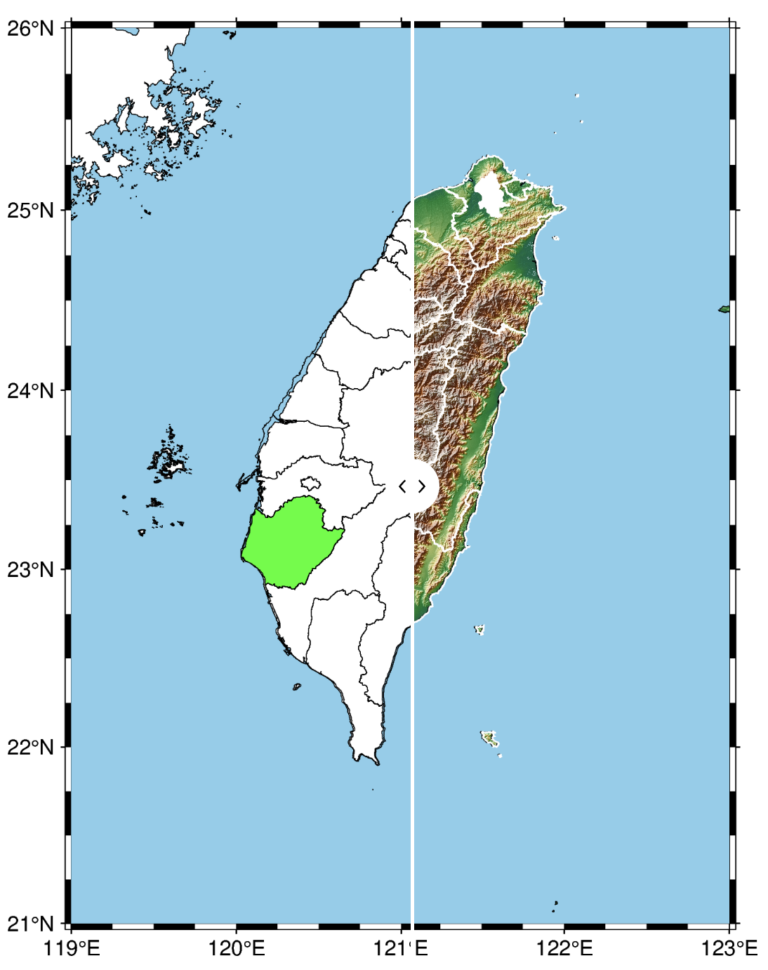
The PyGMT library in Python simplifies the creation of high-resolution topographic maps by providing built-in shorelines, country borders, and topographic data. By integrating geopandas, PyGMT enables users to overlay custom shapefile data, making it easy to highlight specific regions on a map. In this post, we demonstrate how to use county boundary data from Taiwan’s government portal to overlay on a high-resolution map of Taiwan, focusing on selected counties. This method provides a flexible, powerful approach for creating visually striking maps with customized geospatial information, applicable to various regions and datasets.