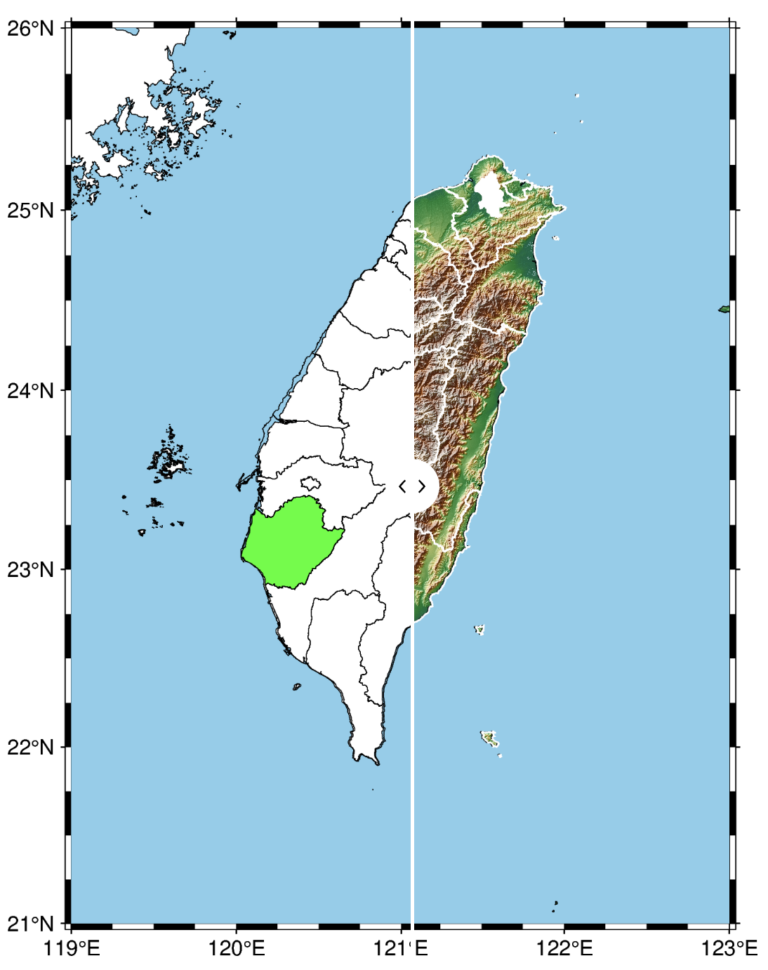
The PyGMT library in Python simplifies the creation of high-resolution topographic maps by providing built-in shorelines, country borders, and topographic data. By integrating geopandas, PyGMT enables users to overlay custom shapefile data, making it easy to highlight specific regions on a map. In this post, we demonstrate how to use county boundary data from Taiwan’s government portal to overlay on a high-resolution map of Taiwan, focusing on selected counties. This method provides a flexible, powerful approach for creating visually striking maps with customized geospatial information, applicable to various regions and datasets.
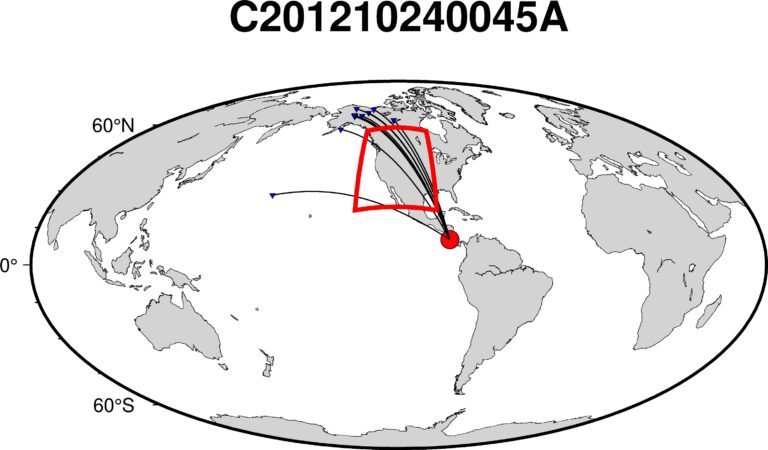
In this article, we will learn how to visualize the great circle paths that traverse a designated region of interest using PyGMT. Understanding these paths is crucial for rigorous seismic tomography investigations, as they can provide insights into the subsurface structure below the select region of interest.
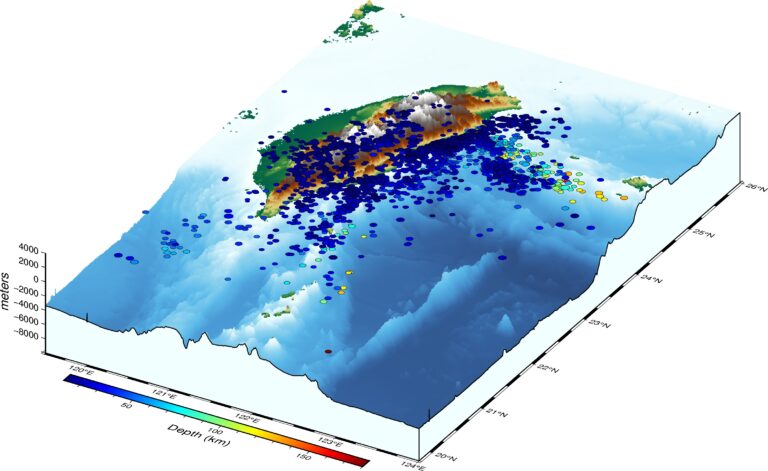
Read the earthquake data from a data file and overlay on a three-dimensional topographic map using PyGMT
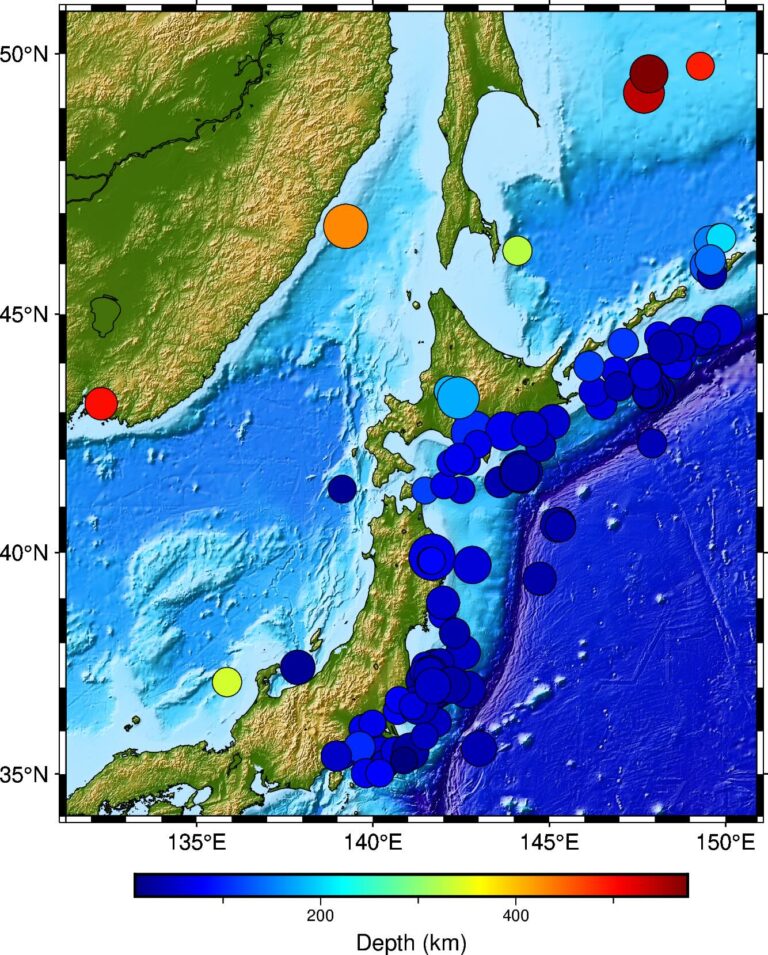
Read the earthquake data from a csv file and overlay on a topographic map using PyGMT.
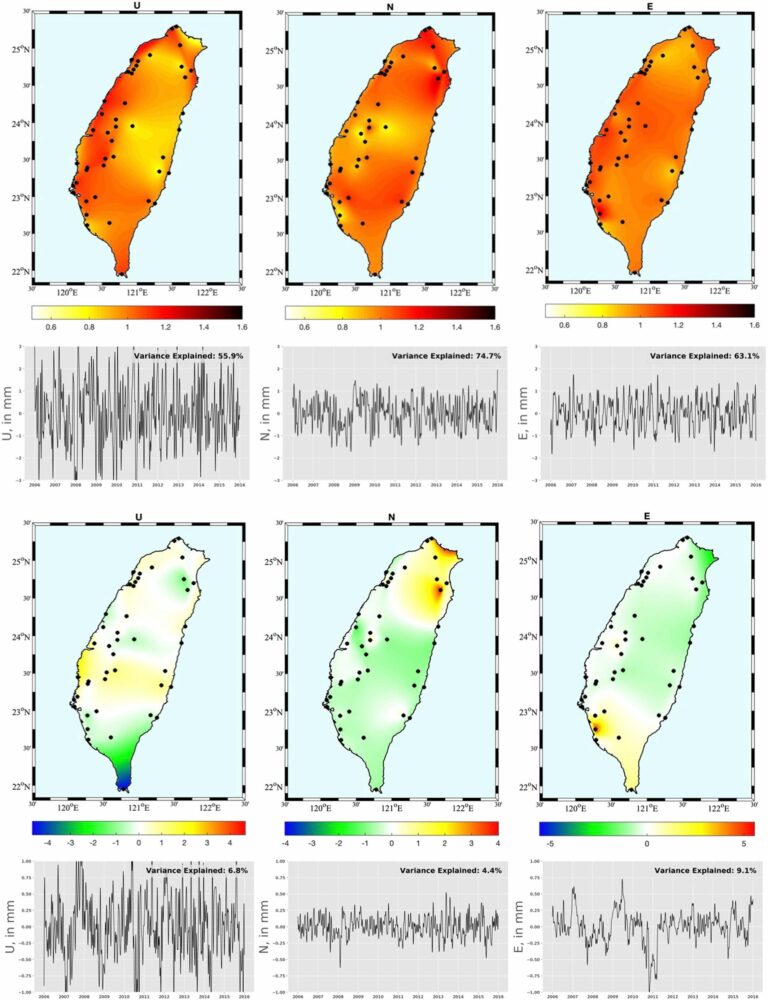
Empirical Orthogonal Functions analysis decomposes the continuous space-time field into a set of orthogonal spatial patterns along with a set of associated uncorrelated time series or principal components. Introductory concepts of EOF analysis
This article demonstrates how to create shaded topographic maps in Python, emulating the style of Generic Mapping Tools (GMT) by incorporating shading effects to enhance terrain visualization. It provides detailed instructions and code examples, enabling users to generate high-quality relief maps using Python's capabilities.