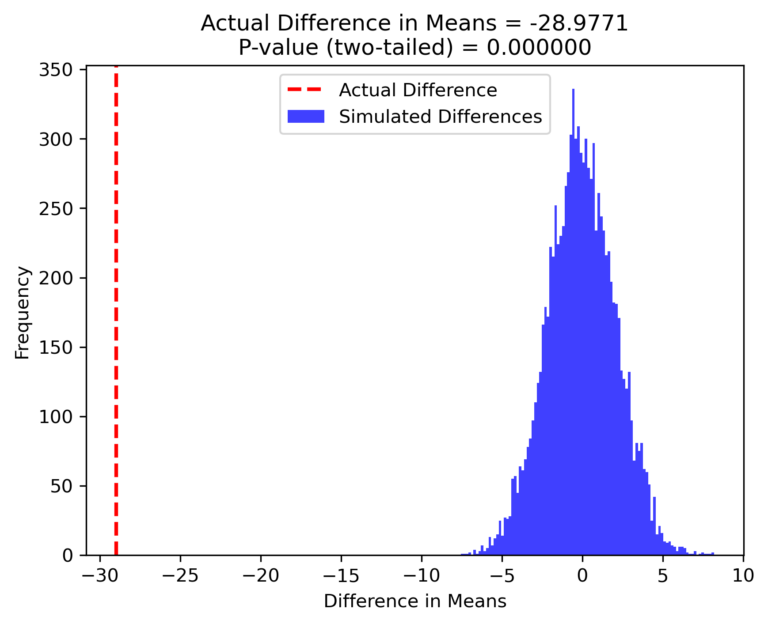
Monte Carlo Simulation for Correlation Testing: Python and MATLAB Implementations
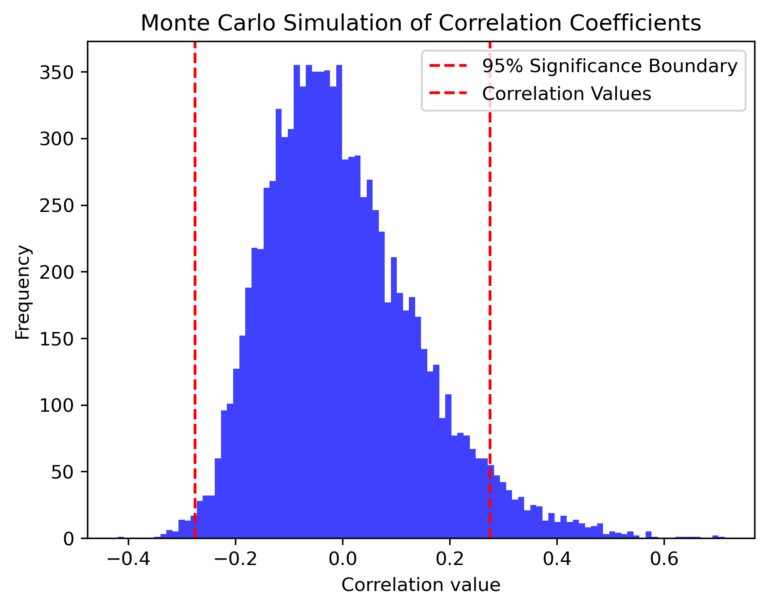
Discover how to test the significance of correlations between datasets using Monte Carlo simulations, with step-by-step implementations in both Python and MATLAB. Learn how to leverage randomization to assess the robustness of your statistical findings.